

Severe thunderstorms are expected from central Texas to middle Tennessee and Kentucky this afternoon into tonight. Large hail and damaging winds are the main threats. Heavy to excessive rainfall may produce areas of flooding today and tonight from central Texas into the lower Mississippi Valley.
Overview
This page provides a variety of information related to drought.
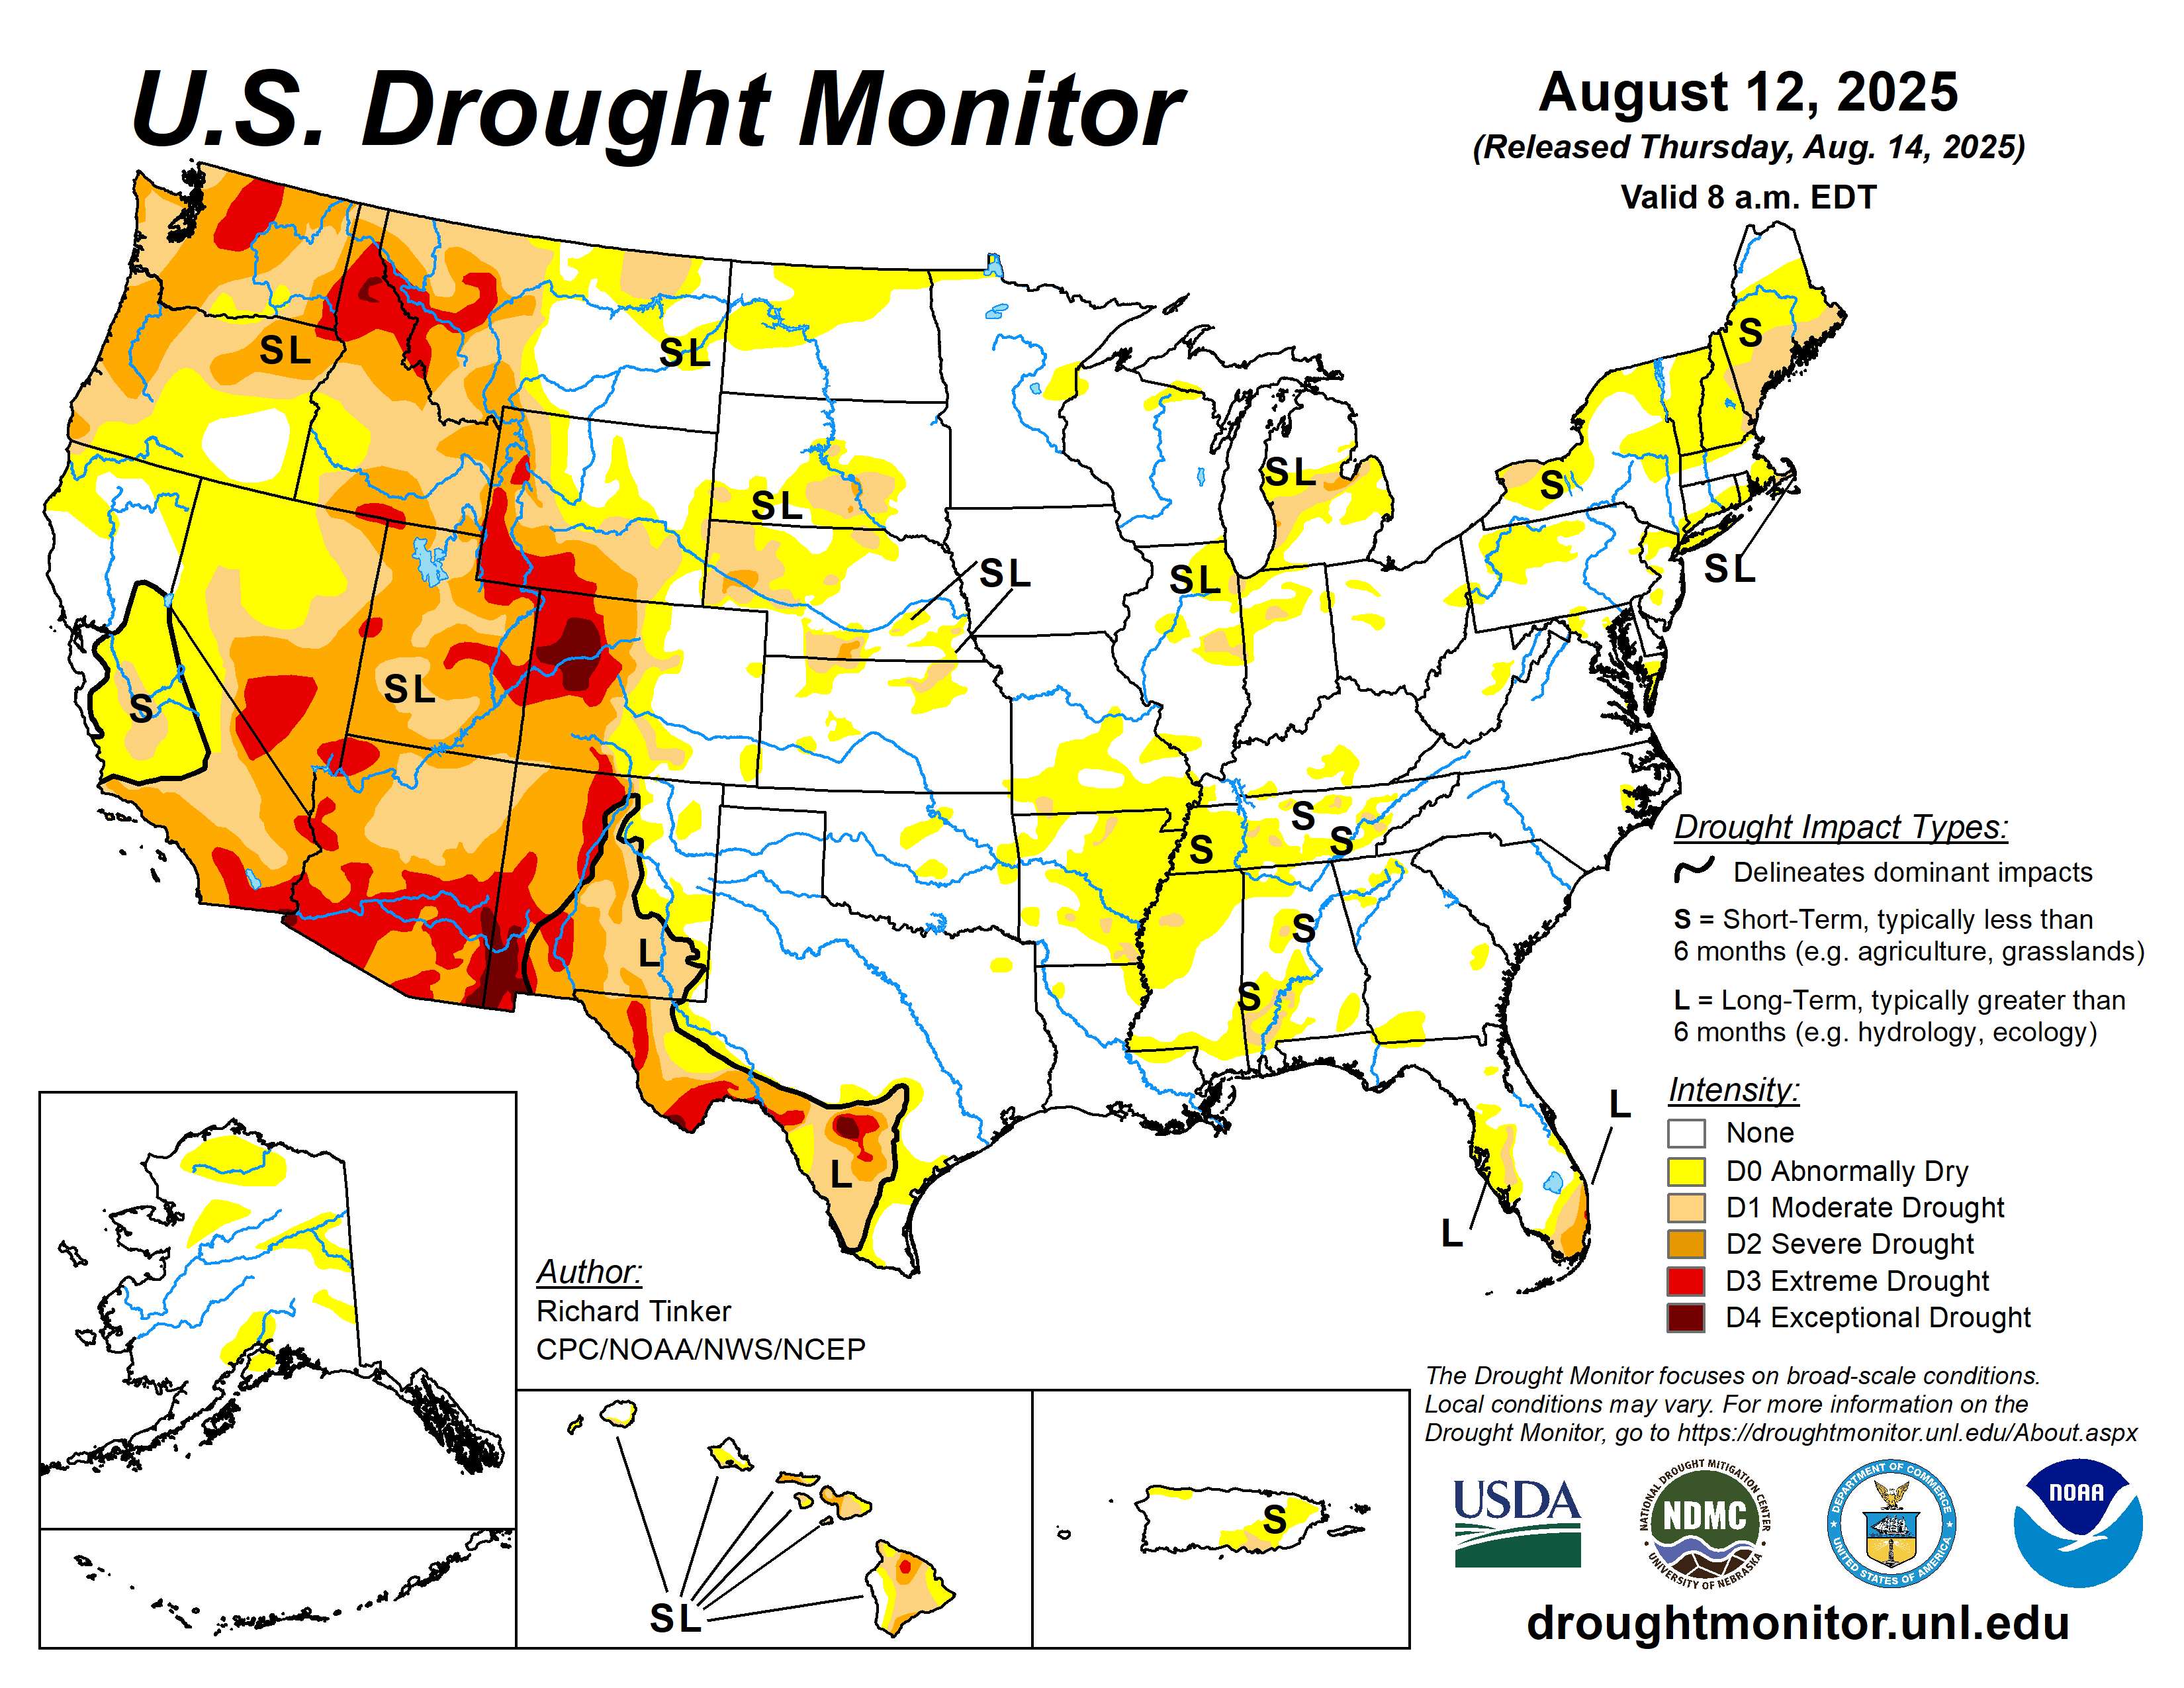
Current Drought Maps
  |
The categories of drought are defined as follows: Abnormally Dry (D0) - Going into drought: short-term dryness slowing planting, growth of crops or pastures; fire risk above average. Coming out of drought: some lingering water deficits; pastures or crops not fully recovered. Moderate Drought (D1) - Some damage to crops, pastures; fire risk high; streams, reservoirs, or wells low, some water shortages developing or imminent, voluntary water use restrictions requested. Severe Drought (D2) - Crop or pasture losses likely; fire risk very high; water shortages common; water restrictions imposed. Extreme Drought (D3) - Major crop/pasture losses; extreme fire danger; widespread water shortages or restrictions. Exceptional Drought (D4) - Exceptional and widespread crop/pasture losses; exceptional fire risk; shortages of water in reservoirs, streams, and wells, creating water emergencies. |
||
Nebraska |
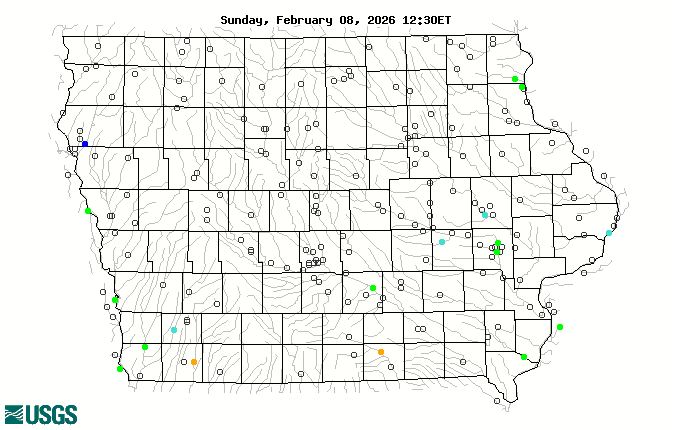
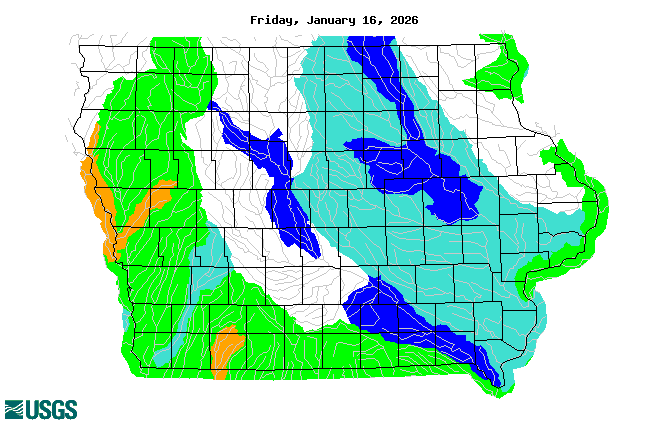
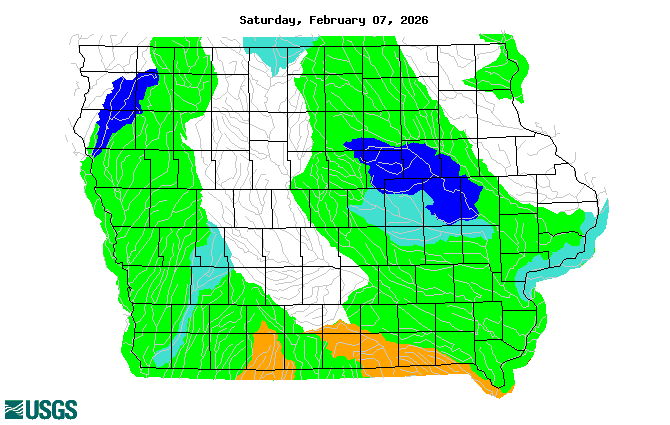
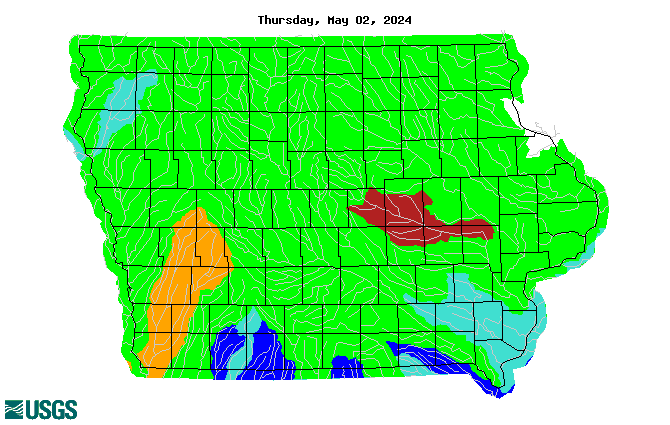
Iowa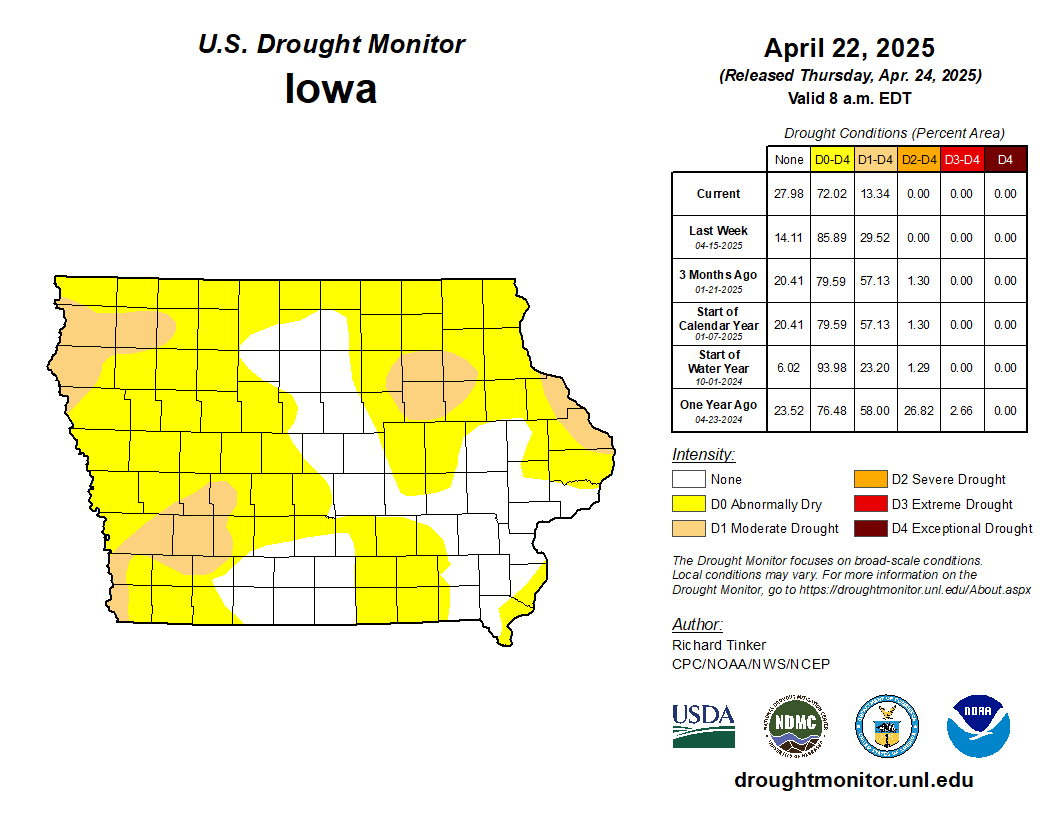 |
||
 |
|||
Drought Change Maps
|
|
The categories of drought are defined as follows: Abnormally Dry (D0) - Going into drought: short-term dryness slowing planting, growth of crops or pastures; fire risk above average. Coming out of drought: some lingering water deficits; pastures or crops not fully recovered. Moderate Drought (D1) - Some damage to crops, pastures; fire risk high; streams, reservoirs, or wells low, some water shortages developing or imminent, voluntary water use restrictions requested. Severe Drought (D2) - Crop or pasture losses likely; fire risk very high; water shortages common; water restrictions imposed. Extreme Drought (D3) - Major crop/pasture losses; extreme fire danger; widespread water shortages or restrictions. Exceptional Drought (D4) - Exceptional and widespread crop/pasture losses; exceptional fire risk; shortages of water in reservoirs, streams, and wells, creating water emergencies. |
||
1 Week Change |
4 Week Change |
||
8 Week Change |
12 Week Change |
||
26 Week Change |
52 Week Change |
||
Local Drought Statement
Past Precipitation
Click the image to enlarge.
 |
 |
| Precipitation | Departure from Normal | Percent of Normal | |
|---|---|---|---|
| 7 days |  |
 |
 |
| 14 days |  |
 |
 |
| 30 days |  |
 |
 |
| 60 days |  |
 |
 |
| 90 days |  |
 |
 |
| Standardized Precipitation Index |
 |
 |
 |
Forecast Precipitation
Click the image to enlarge.
Day 1 |
Day 2 |
Day 3 |
Days 4-5 |
Days 6-7 |
7 Day Total |
Days 6-10 |
Days 8-14 |
Soil Moisture
The maps show the departure from normal 30-year climatology.


 |
 |
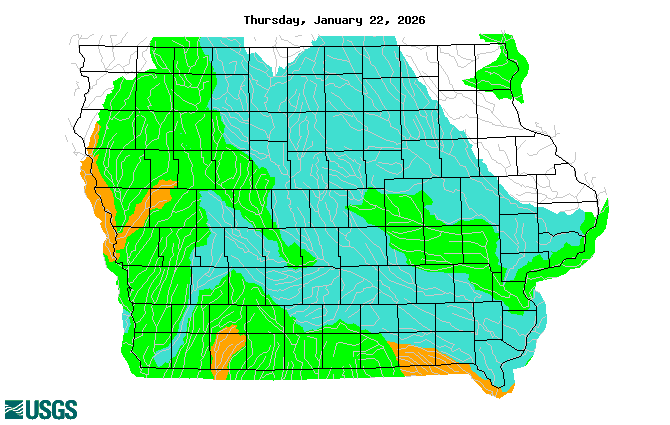
Streamflow
Click the image to enlarge.
| Real Time | 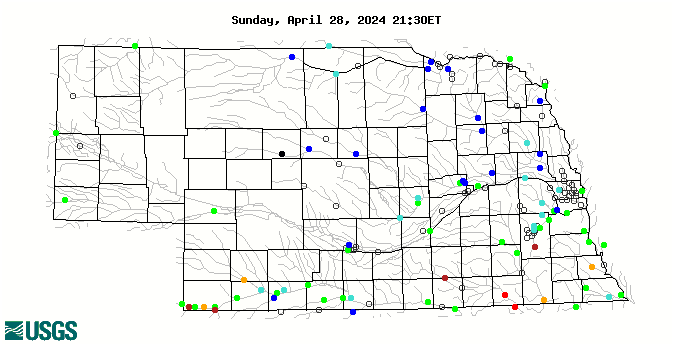 |
 |
| Daily | 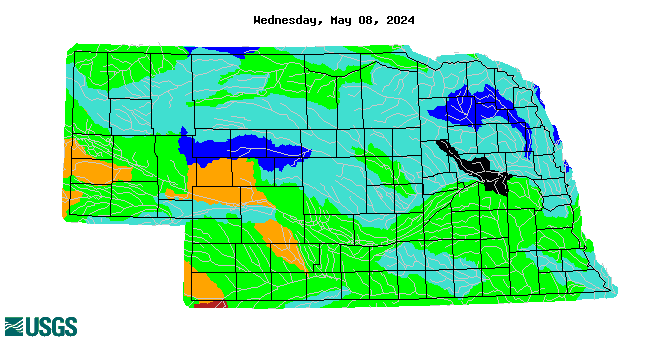 |
 |
| 7 Day | 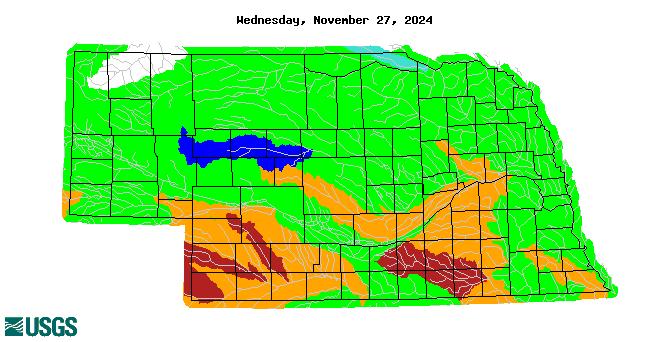 |
 |
| 14 Day | 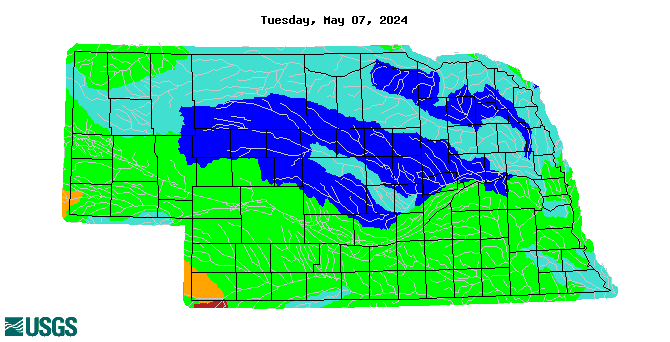 |
 |
| 28 Day | 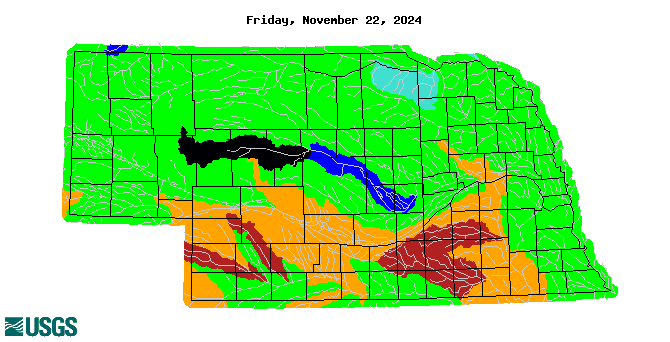 |
 |
Drought Outlooks
Click the image to enlarge.
Monthly Drought Outlook |
Seasonal Drought Outlook |
Climate Outlooks
Click the image to enlarge.
Weeks 3-4 Temperature |
Weeks 3-4 Precipitation |
Monthly Temperature |
Monthly Precipitation |
Three Monthly Temperature |
Three Monthly Precipitation |
County Browser
Click the map below to view county-specific drought information.
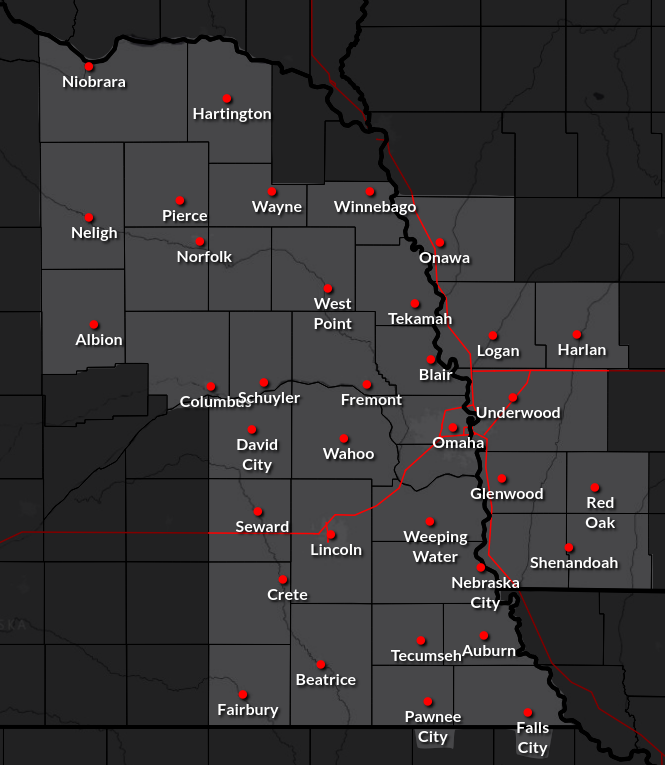
Clicking the map will open a new window at the
Other Resources