
 |
|
NEW - Graphical Drought Information Statement - Click HERE |
Current/Recent/Past Drought:
The , established in 1999, is a weekly map of drought conditions that is produced jointly by the , the , and the at the University of Nebraska-Lincoln. The U.S. Drought Monitor website is hosted and maintained by the NDMC.
U.S. Drought Monitor maps are updated every Thursday morning at 7:30 a.m., based on data through 6 a.m. the preceding Tuesday. The map is based on measurements of climatic, hydrologic and soil conditions as well as reported impacts and observations from more than 350 contributors around the country.
| Current Drought Conditions | Short-Term Drought Indicator |
 |
 |
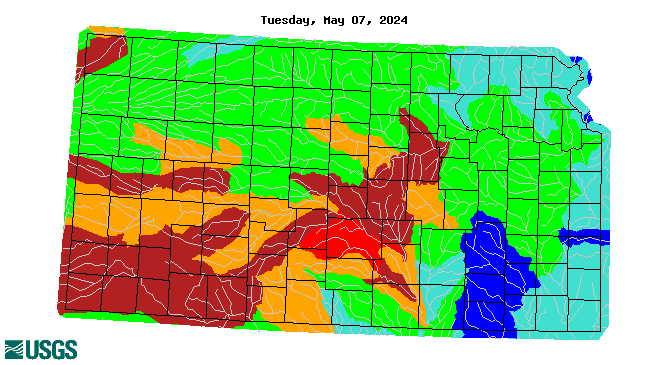
| Current Kansas drought conditions, updated every Thursday morning. Click for an interactive webpage. | The Quick Drought Response Index provides a snapshot of anomalously dry or wet conditions over the past 4 weeks, and serves as an indicator of emerging or rapidly changing drought conditions. Click for more information, and for the full webpage. |
| Drought Change from 4 Weeks Ago | Drought Change from 8 Weeks Ago |
 |
 |
| Drought change from 4 weeks ago. Yellow-Orange-Brown colors mean worsening drought, green colors mean improving drought. Click for more drought trend maps. | Drought change from 8 weeks ago. Yellow-Orange-Brown colors mean worsening drought, green colors mean improving drought. Click for more drought trend maps. |
| 12-Week Past Drought Animation |
 |
Drought Outlook:
| Monthly Drought Outlook | Seasonal Drought Outlook |
 |
 |
Past Precipitation:
The below images (courtesy of the ) represent precipitation totals, departures from normal and percent of normal the past 30, 60, 90 days, the past 6-months, and the past one, two and three years across Kansas. Precipitation includes rainfall, melted-down snow, sleet, freezing, hail, etc. Click each image to enlarge.
Month-to-Date
| Precipitation | Departure from Normal | Percent of Normal |
 |
 |
 |
Year-to-Date
| Precipitation | Departure from Normal | Percent of Normal |
 |
 |
 |
7-Day
| Precipitation | Departure from Normal | Percent of Normal |
 |
 |
 |
14-Day
| Precipitation | Departure from Normal | Percent of Normal |
 |
 |
 |
30-Day
| Precipitation | Departure from Normal | Percent of Normal |
 |
 |
 |
60-Day
| Precipitation | Departure from Normal | Percent of Normal |
 |
 |
 |
90-Day
| Precipitation | Departure from Normal | Percent of Normal |
 |
 |
 |
6-Month
| Precipitation | Departure from Normal | Percent of Normal |
 |
 |
 |
1-Year
| Precipitation | Departure from Normal | Percent of Normal |
 |
 |
 |
2-Year
| Precipitation | Departure from Normal | Percent of Normal |
 |
 |
 |
3-Year
| Precipitation | Departure from Normal | Percent of Normal |
 |
 |
 |
Agricultural Impacts:
Useful Agricultural Resources:
|
1-Week Change in Soil Moisture (%) |
2-Week Change in Soil Moisture (%) |
 |
 |
| Data courtesy of Warm colors indicate decreased soil moisture compared to last week, cool colors indicate increased soil moisture. Data displayed as a percentage. | Data courtesy of Warm colors indicate decreased soil moisture compared to two weeks ago, cool colors indicate increased soil moisture. Data displayed as a percentage. |
|
1-Month Change in Soil Moisture (%) |
3-Month Change in Soil Moisture (%) |
 |
 |
| Data courtesy of Warm colors indicate decreased soil moisture compared to one month ago, cool colors indicate increased soil moisture. Data displayed as a percentage. | Data courtesy of Warm colors indicate decreased soil moisture compared to three months ago, cool colors indicate increased soil moisture. Data displayed as a percentage. |
|
Top 10 cm Soil Moisture Percentile |
Top 40 cm Soil Moisture Percentile |
 |
 |
| Data courtesy of Warm colors indicate below average soil moisture in the top 10 cm, cool colors indicate above average soil moisture. Gray is considered near average soil moisture. Data displayed as a percentage. | Data courtesy of Warm colors indicate below average soil moisture in the top 40 cm, cool colors indicate above average soil moisture. Gray is considered near average soil moisture. Data displayed as a percentage. |
|
Top 100 cm Soil Moisture Percentile |
Top 200 cm Soil Moisture Percentile |
 |
 |
| Data courtesy of Warm colors indicate below average soil moisture in the top 100 cm, cool colors indicate above average soil moisture. Gray is considered near average soil moisture. Data displayed as a percentage. | Data courtesy of Warm colors indicate below average soil moisture in the top 200 cm, cool colors indicate above average soil moisture. Gray is considered near average soil moisture. Data displayed as a percentage. |
Hydrological Impacts:
| Current Palmer Hydrological Drought Index | |
 |
|
| Depicts hydrological conditions affected by long-term (months, years) wet or dry conditions. Responds slowly and changes little from week to week. Courtesy of |
| Kansas Real-Time Streamflow Compared to Normal | Kansas Past Week Streamflow Compared to Normal |
 |
 |
| Kansas real-time streamflow compared to normal. Green is near normal, blue above normal, and orange/red are below normal. Click for interactive webpage. | Kansas past week streamflow compared to normal. Green is near normal streamflow, blue is above normal streamflow, orange and red are below normal streamflow. Click for interactive webpage. |
Other Useful Hydrological Resources:
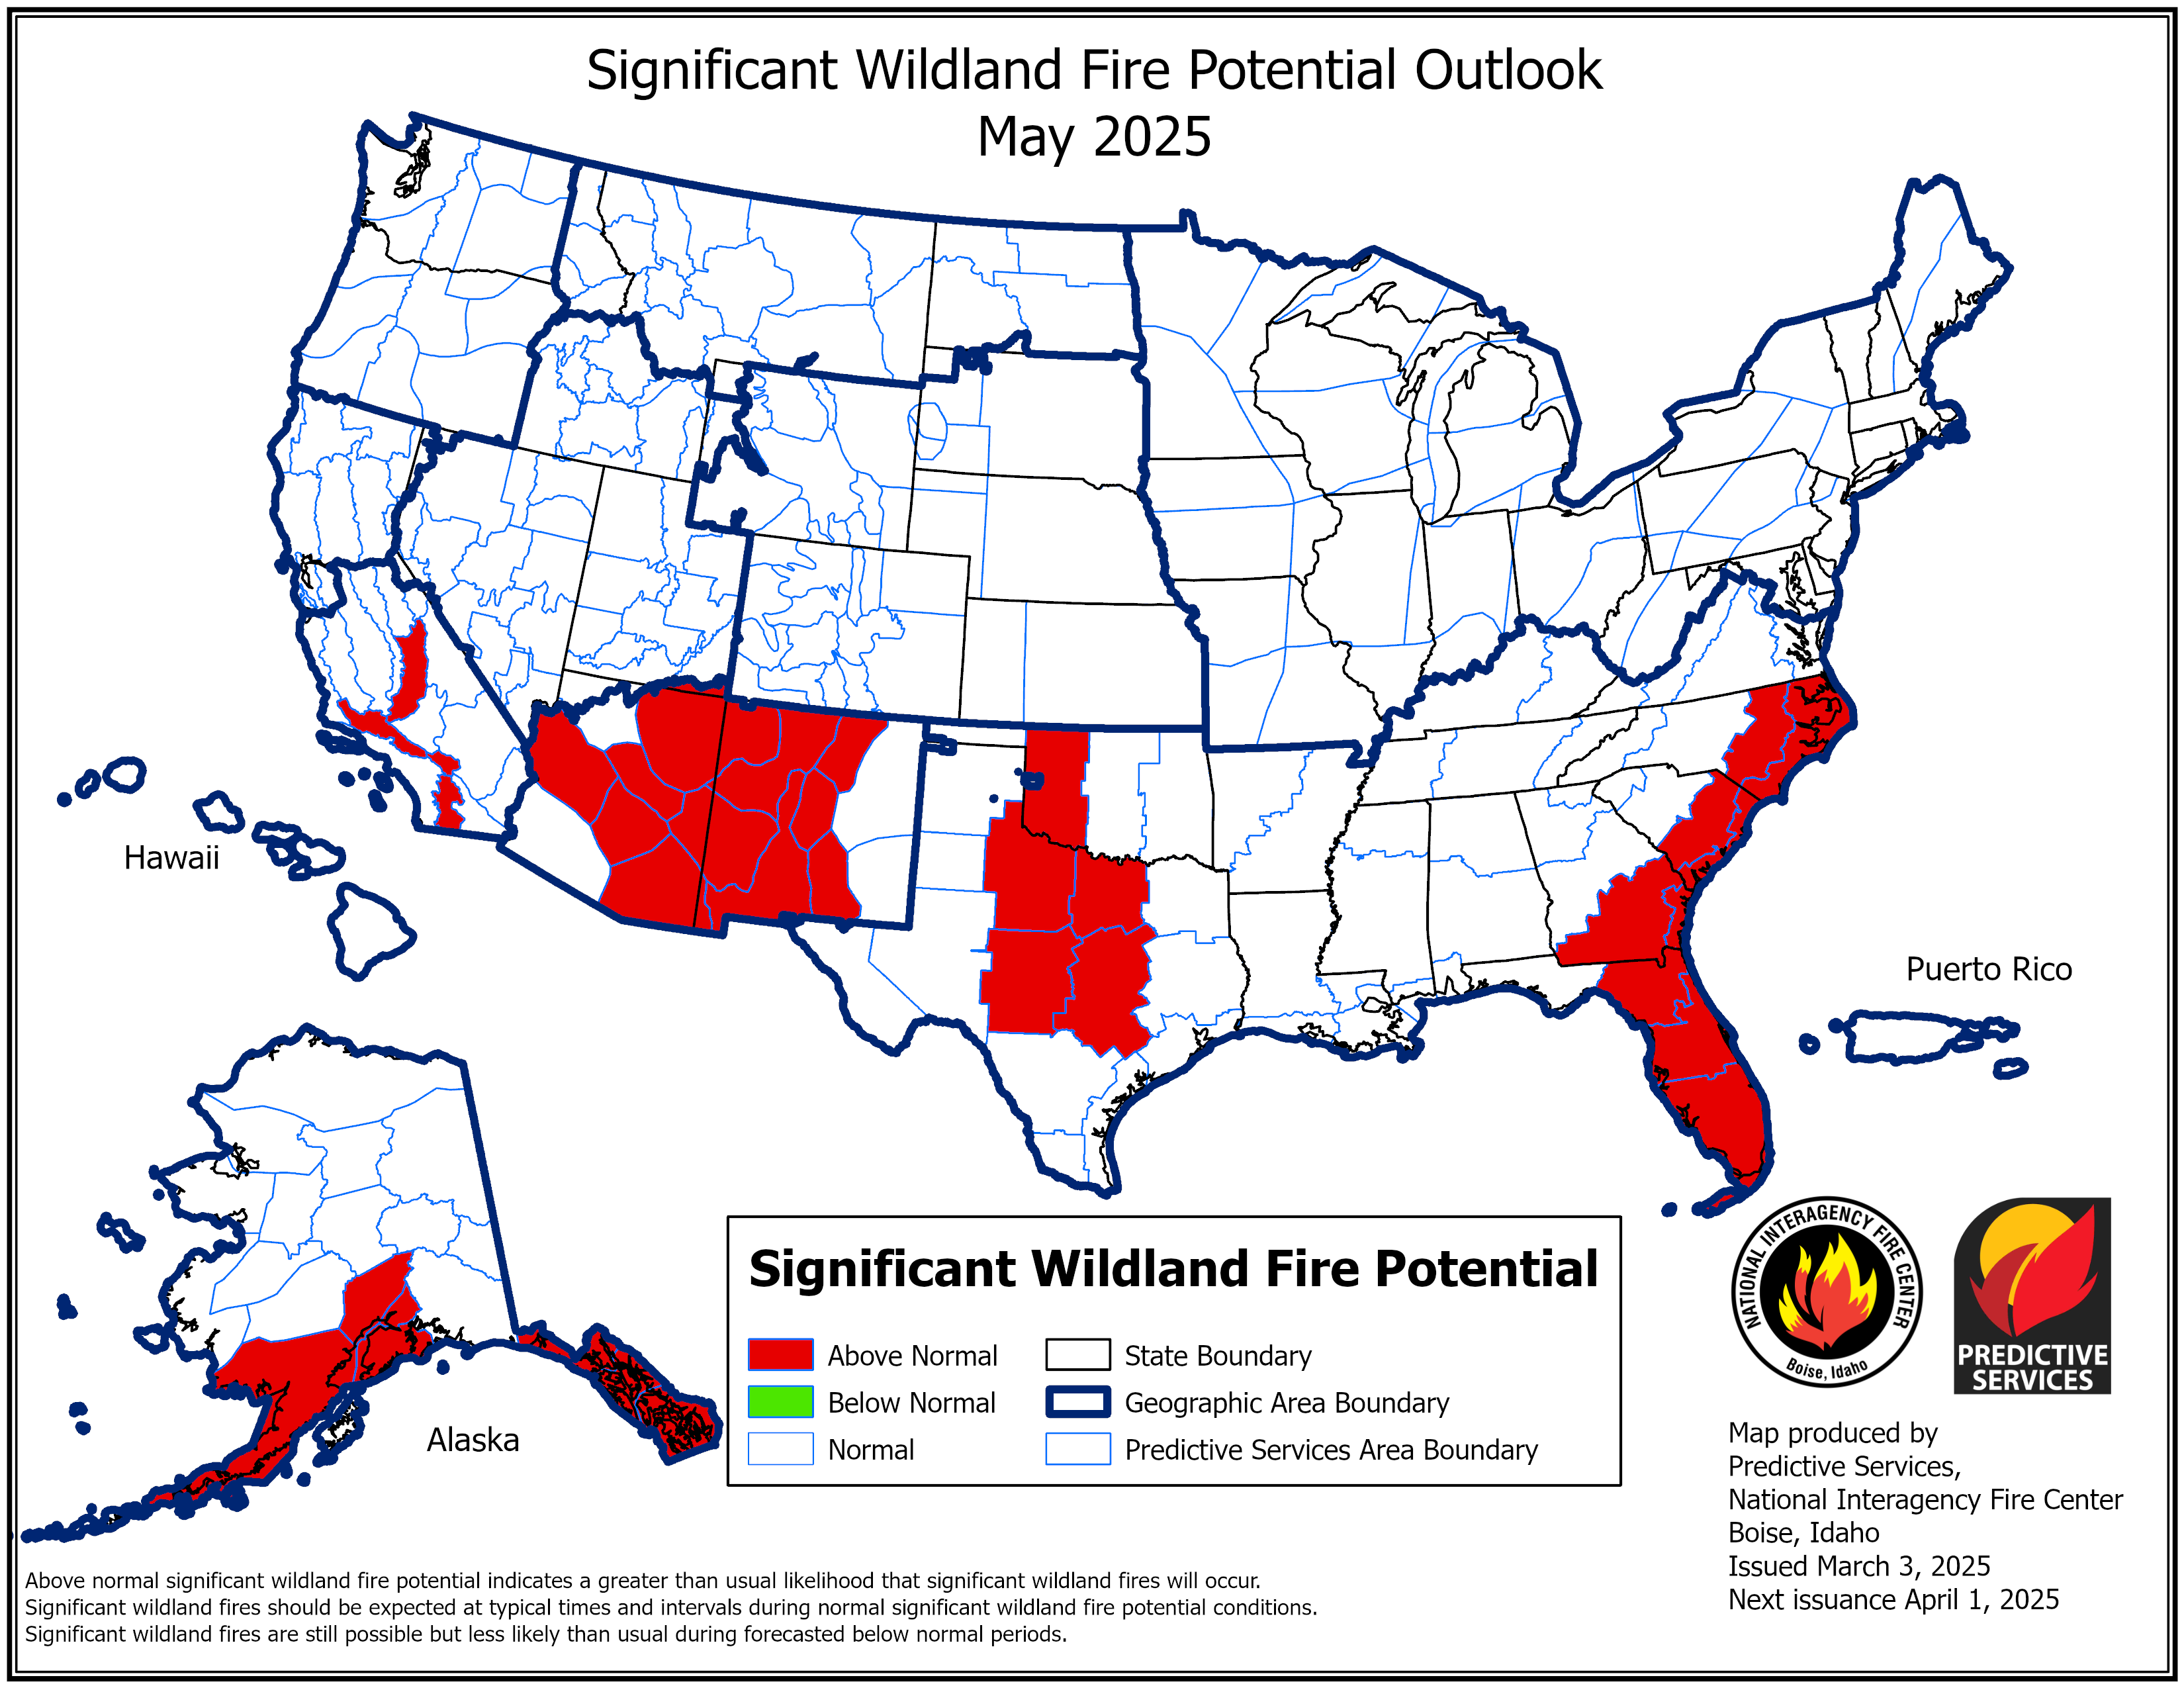
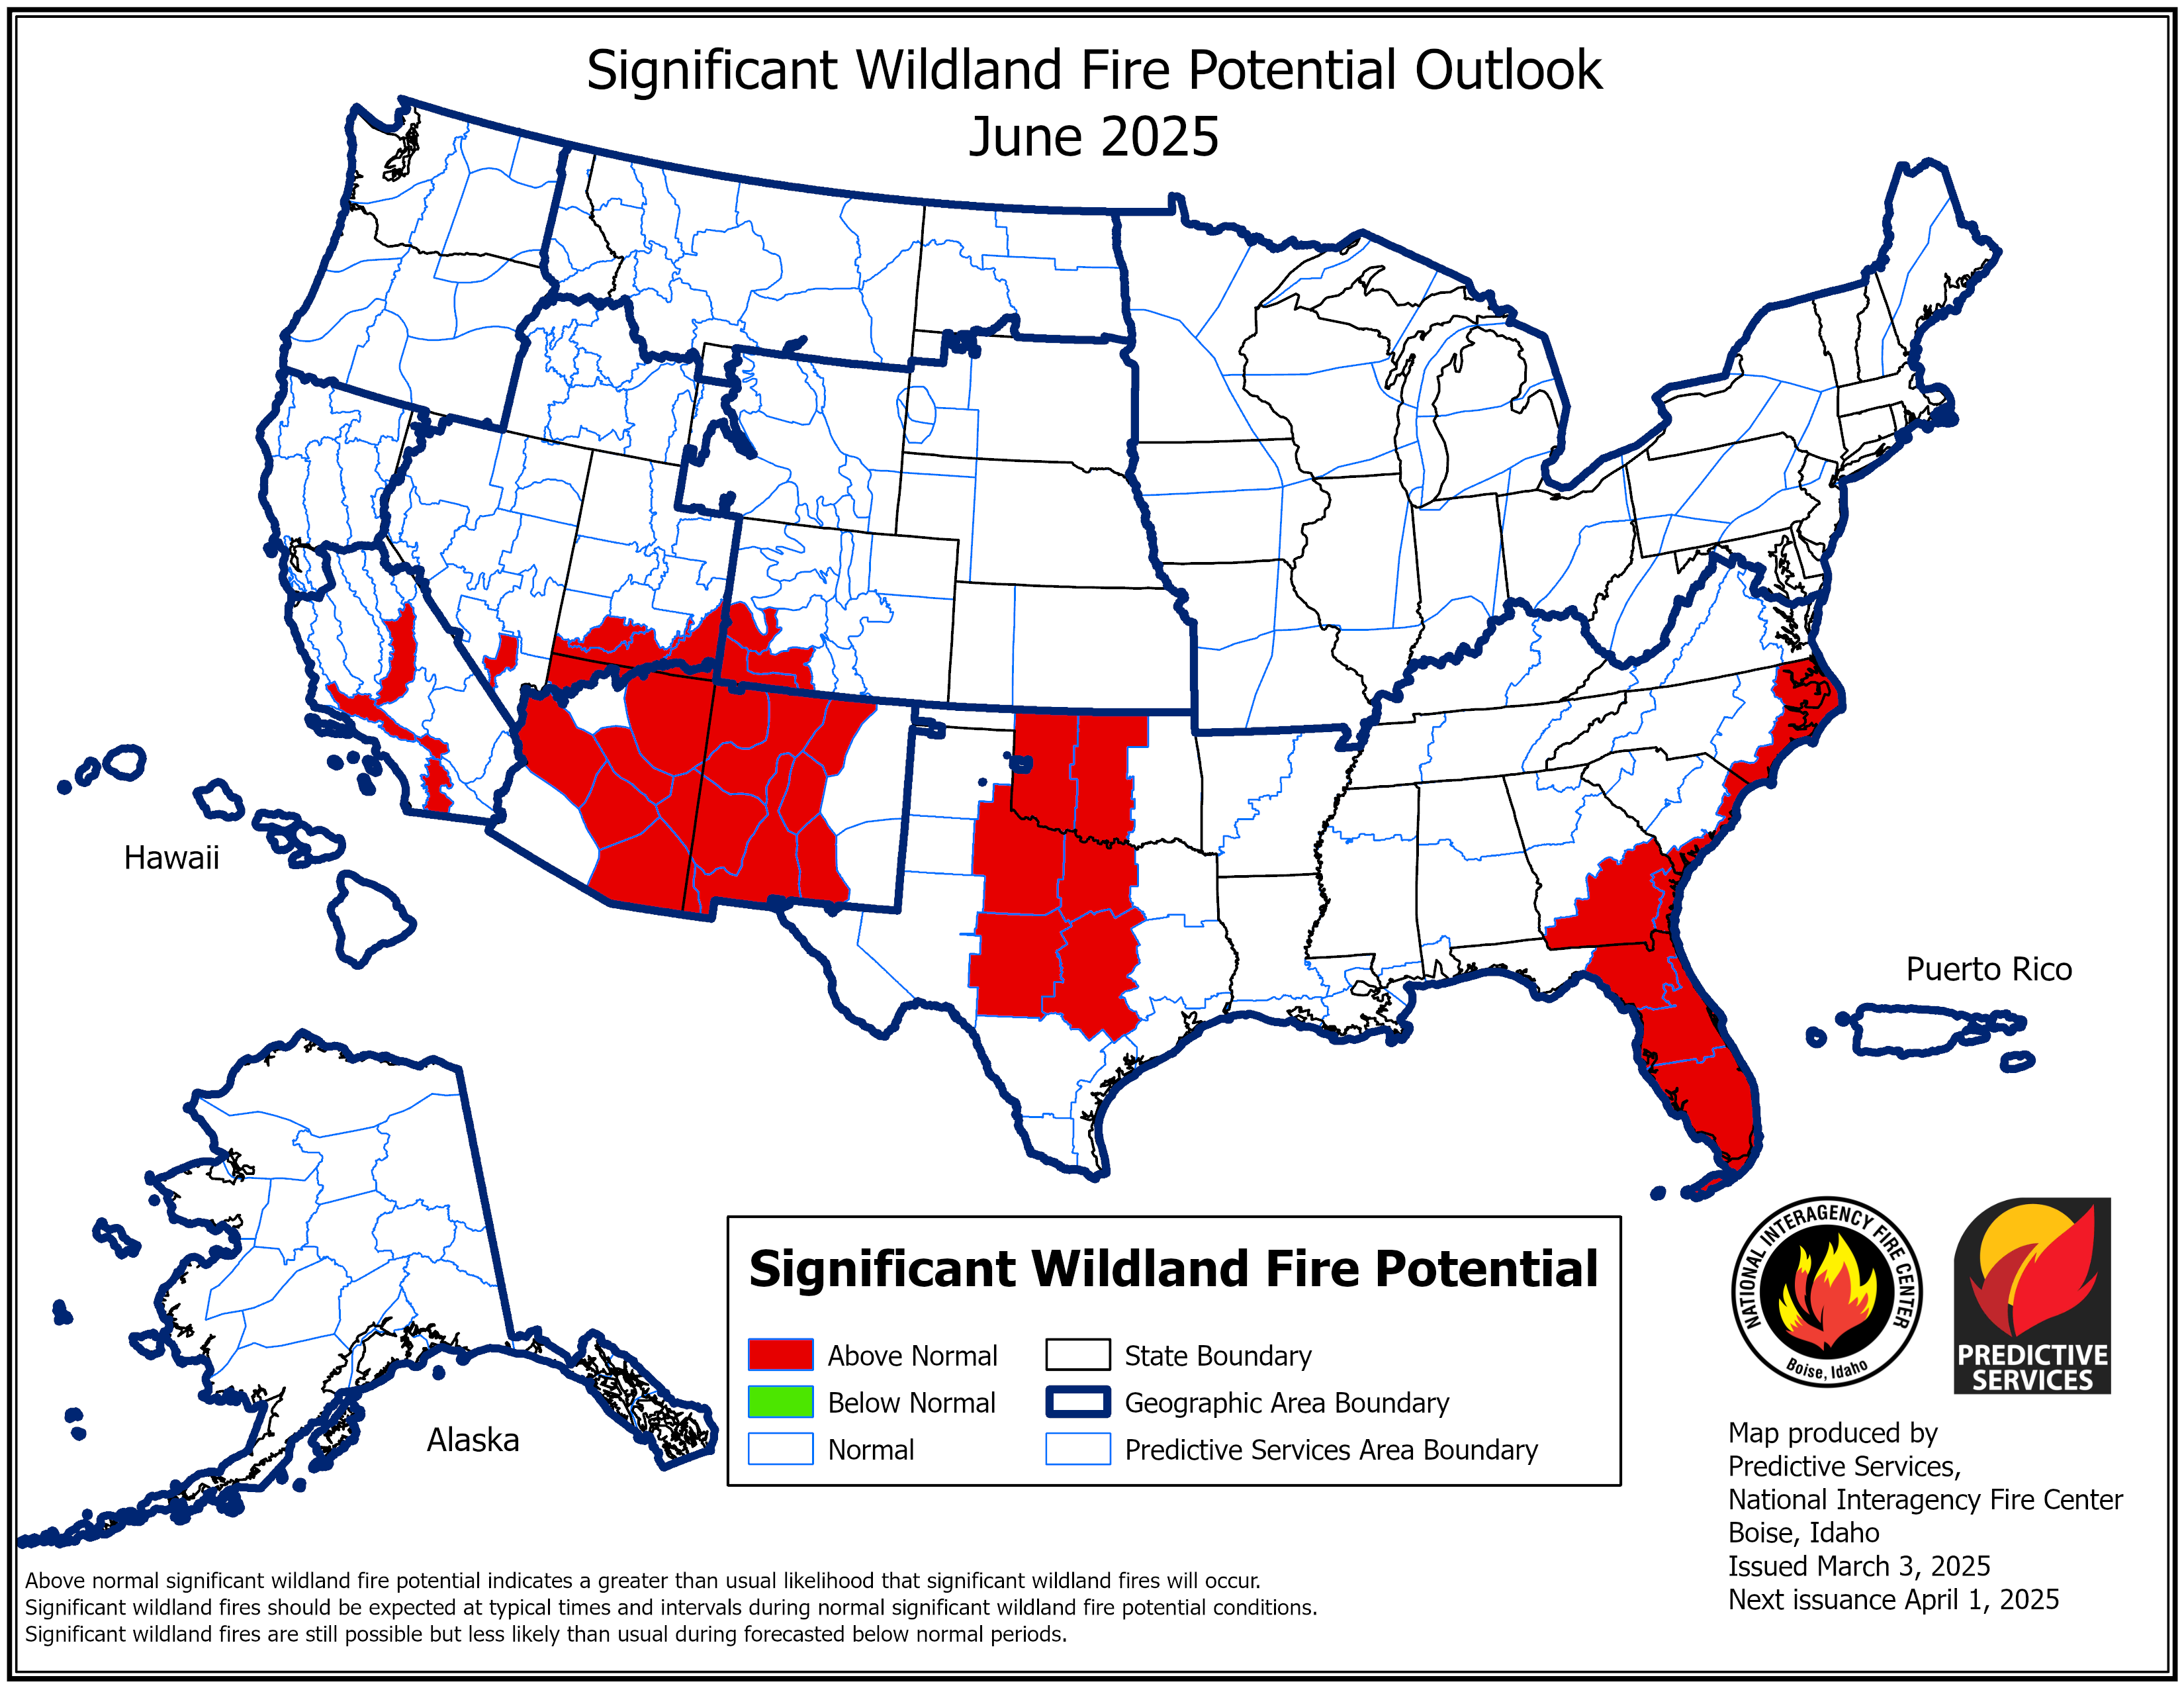
Fire Weather Impacts:
Significant wildland fire potential outlooks courtesy of They represent the cumulative forecasts of the eleven Geographic Area Predictive Services Units and the National Predictive Services Unit. The entire text document for these outlooks can be found at the following link, . The outlooks are updated on the first of each month.
| One-Month Outlook | Two-Month Outlook |
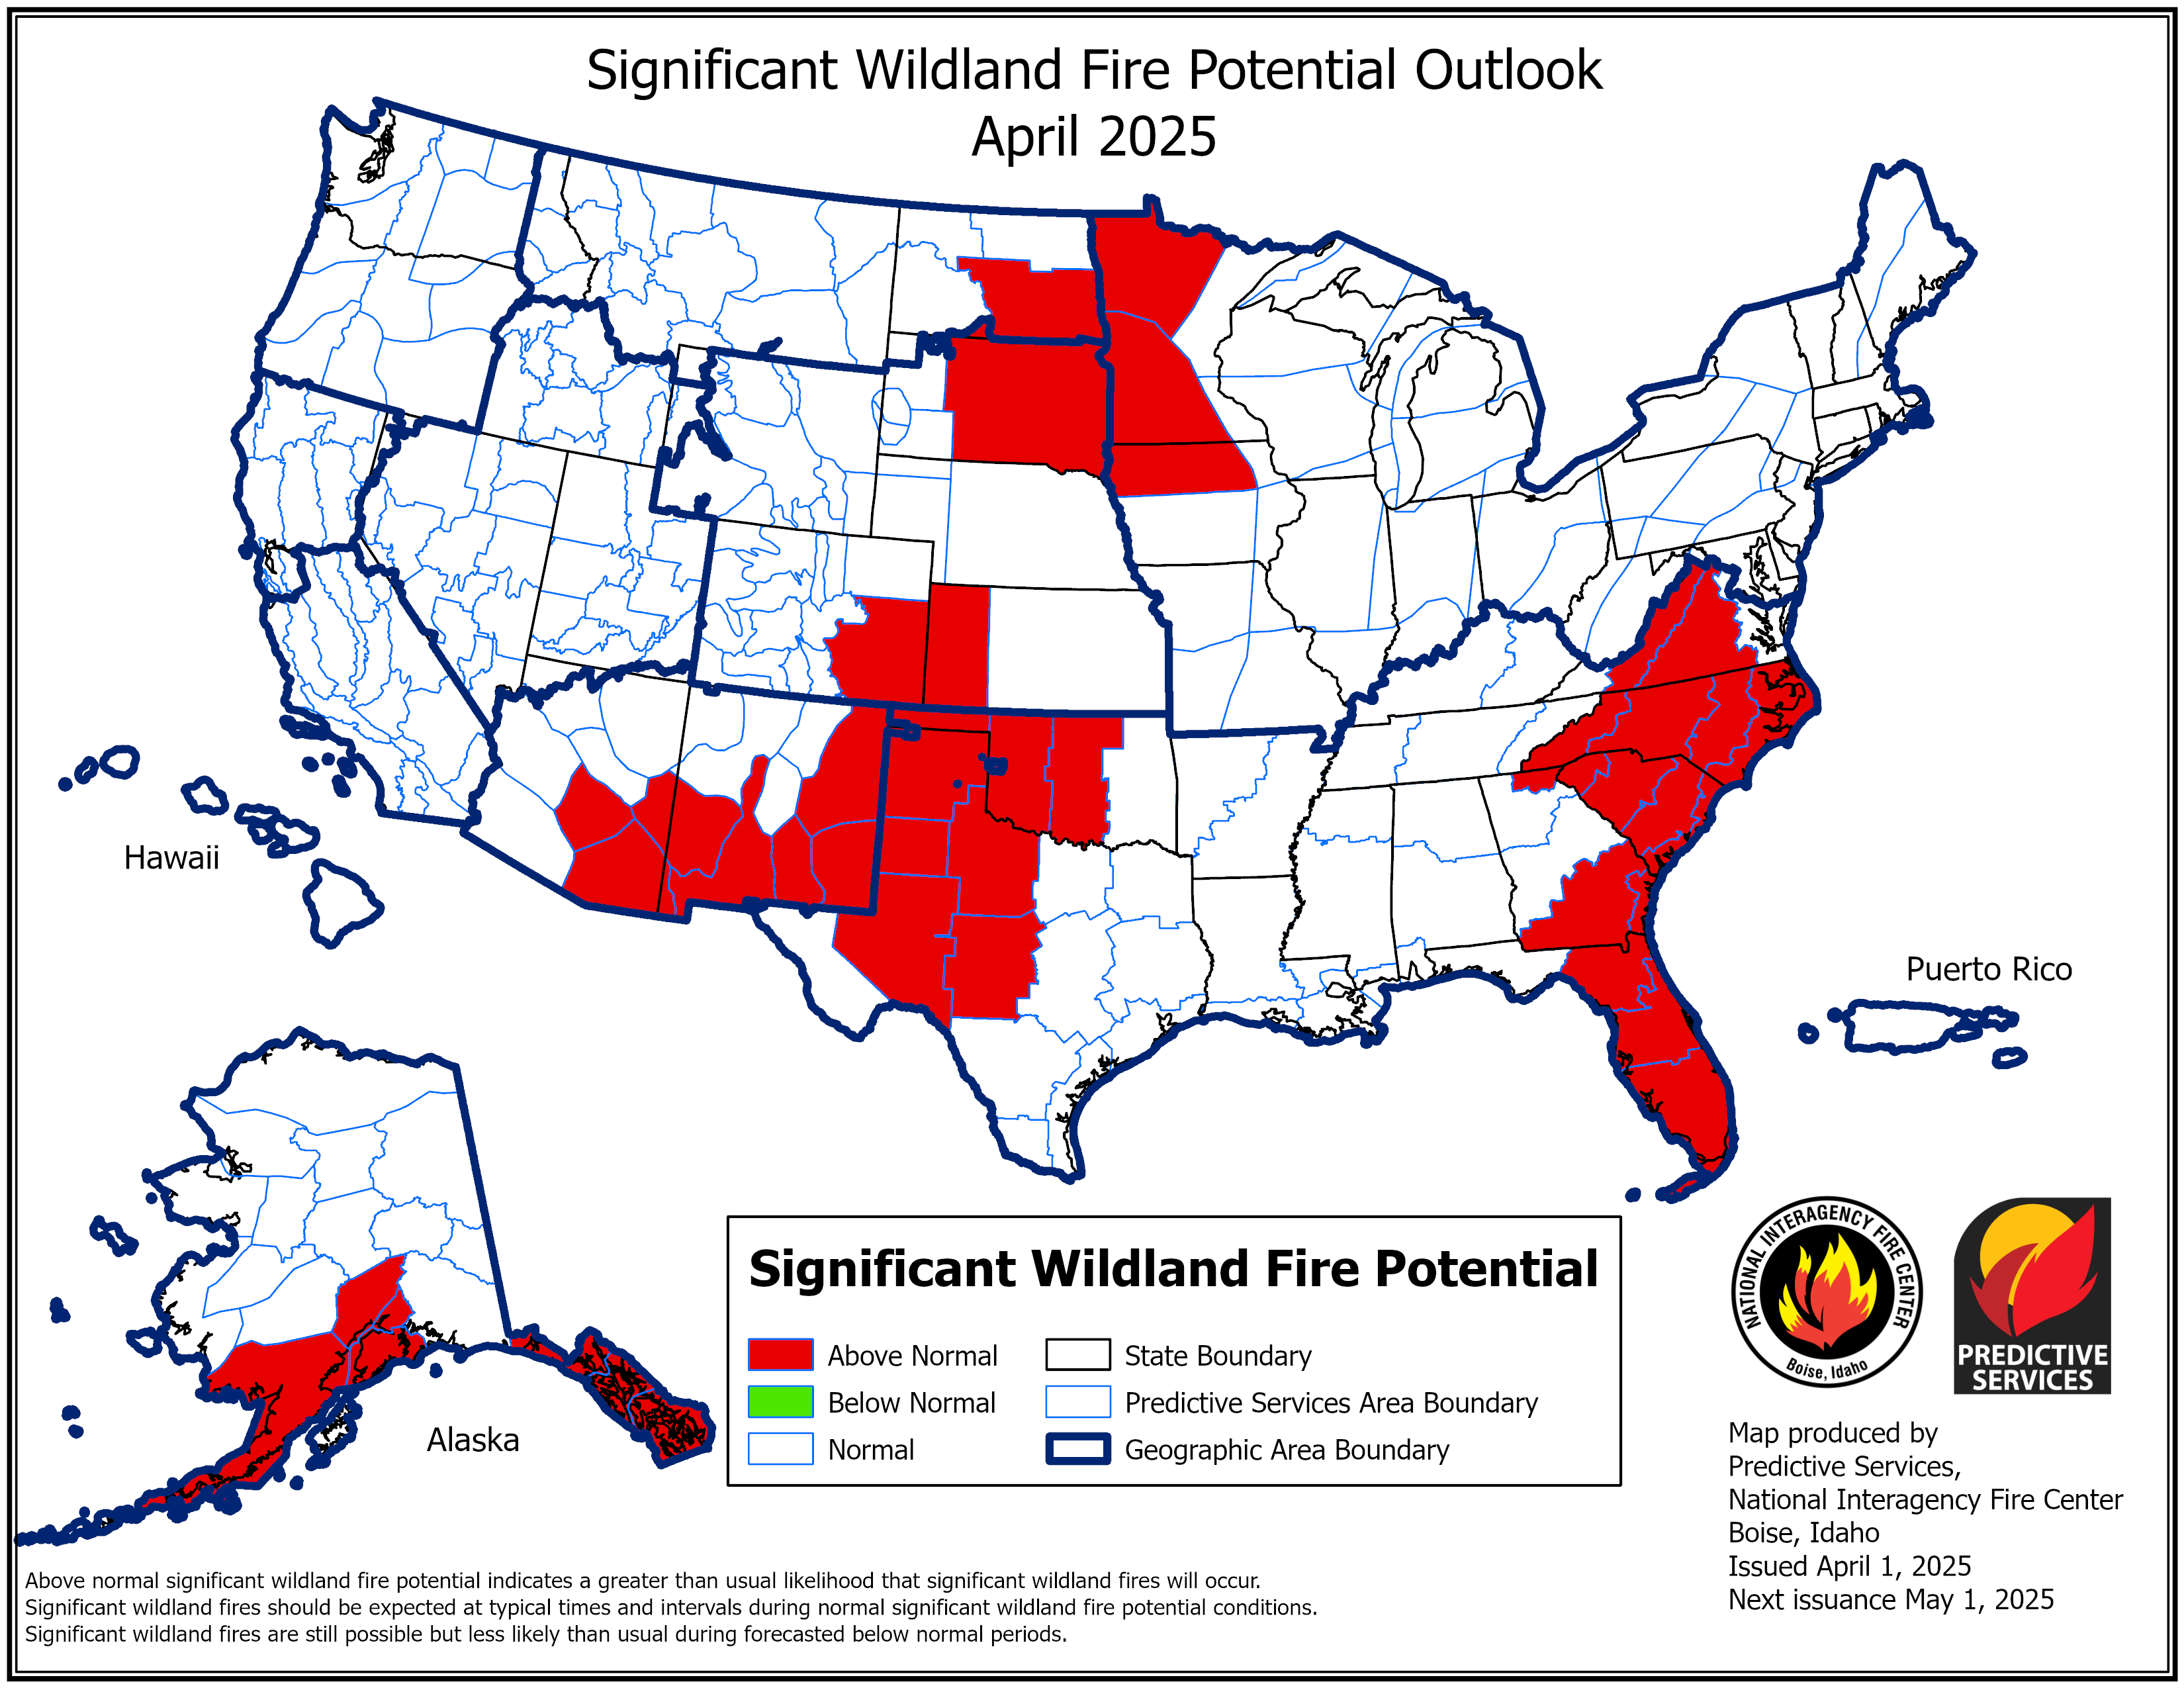 |
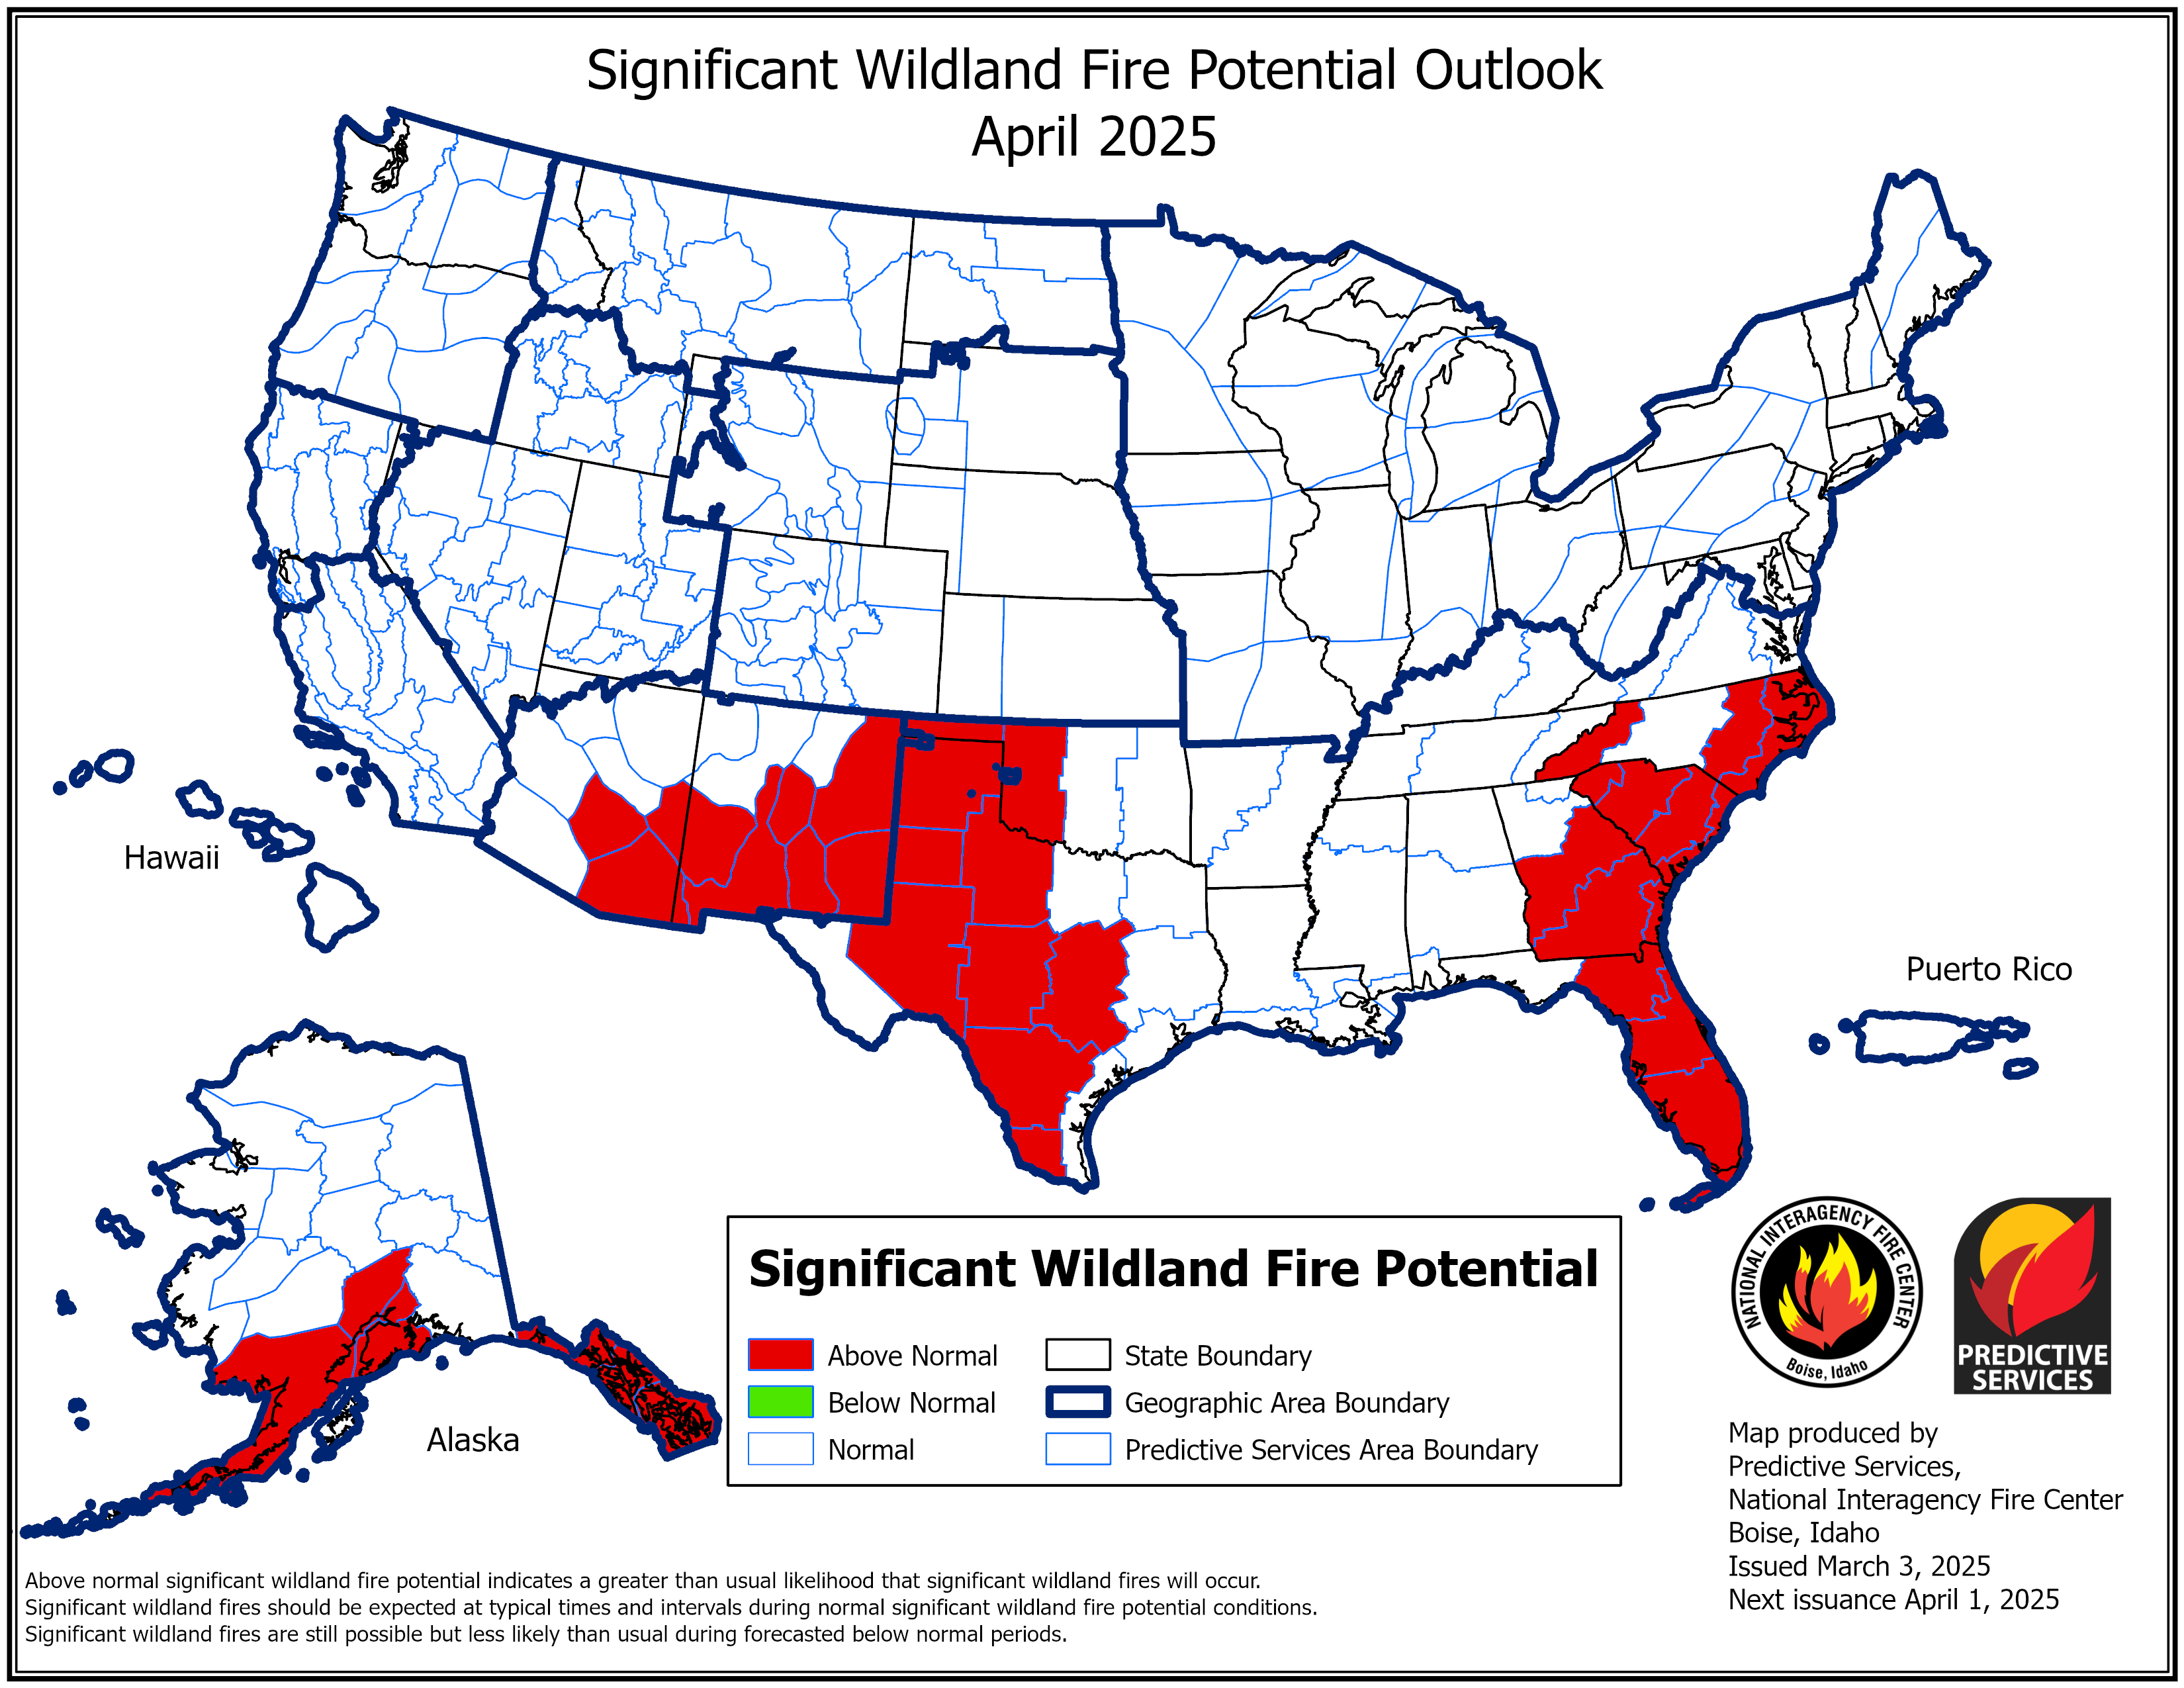 |
| Three-Month Outlook | Four-Month Outlook |
 |
 |
Temperature/Precipitation Outlooks:
7-Day Forecast Precipitation
 |
| Forecast precipitation for the next 7 days issued by the Forecasts are updated a few times each day. |
The below long-range outlooks are courtesy of the They indicate probabilities of above, near or below normal temperature/precipitation for the given time period. They do NOT represent the expected magnitude of warm/cool and/or wet/dry weather.
6-10 Day Outlook
| Temperature | Precipitation |
 |
 |
8-14 Day Outlook
| Temperature | Precipitation |
 |
 |
3-4 Week Outlook
| Temperature | Precipitation |
 |
 |
One-Month Outlook
| Temperature | Precipitation |
 |
 |
Three-Month Outlook
| Temperature | Precipitation |
 |
 |
Additional Information:
Questions/Comments?
Please don't hesitate to contact us with any questions or comments regarding this drought page, or about drought or climate in general.
|
˛©ĚĺÓý 2142 S. Tyler Rd Wichita, KS 67209 316-942-8483 |
 |
|