
| Graphics within this page can be magnified (enlarged) by left clicking on them and resized back to original size with a second click. |
| Drought Monitoring Graphics | Drought Analysis Links | |
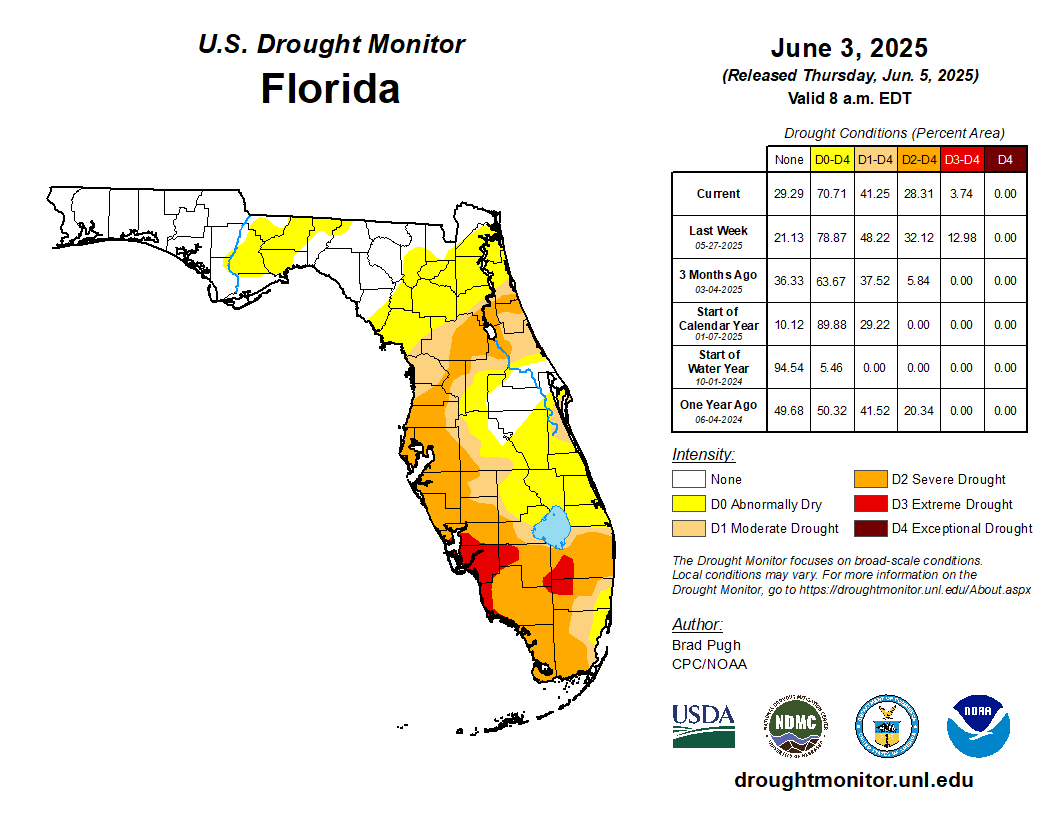  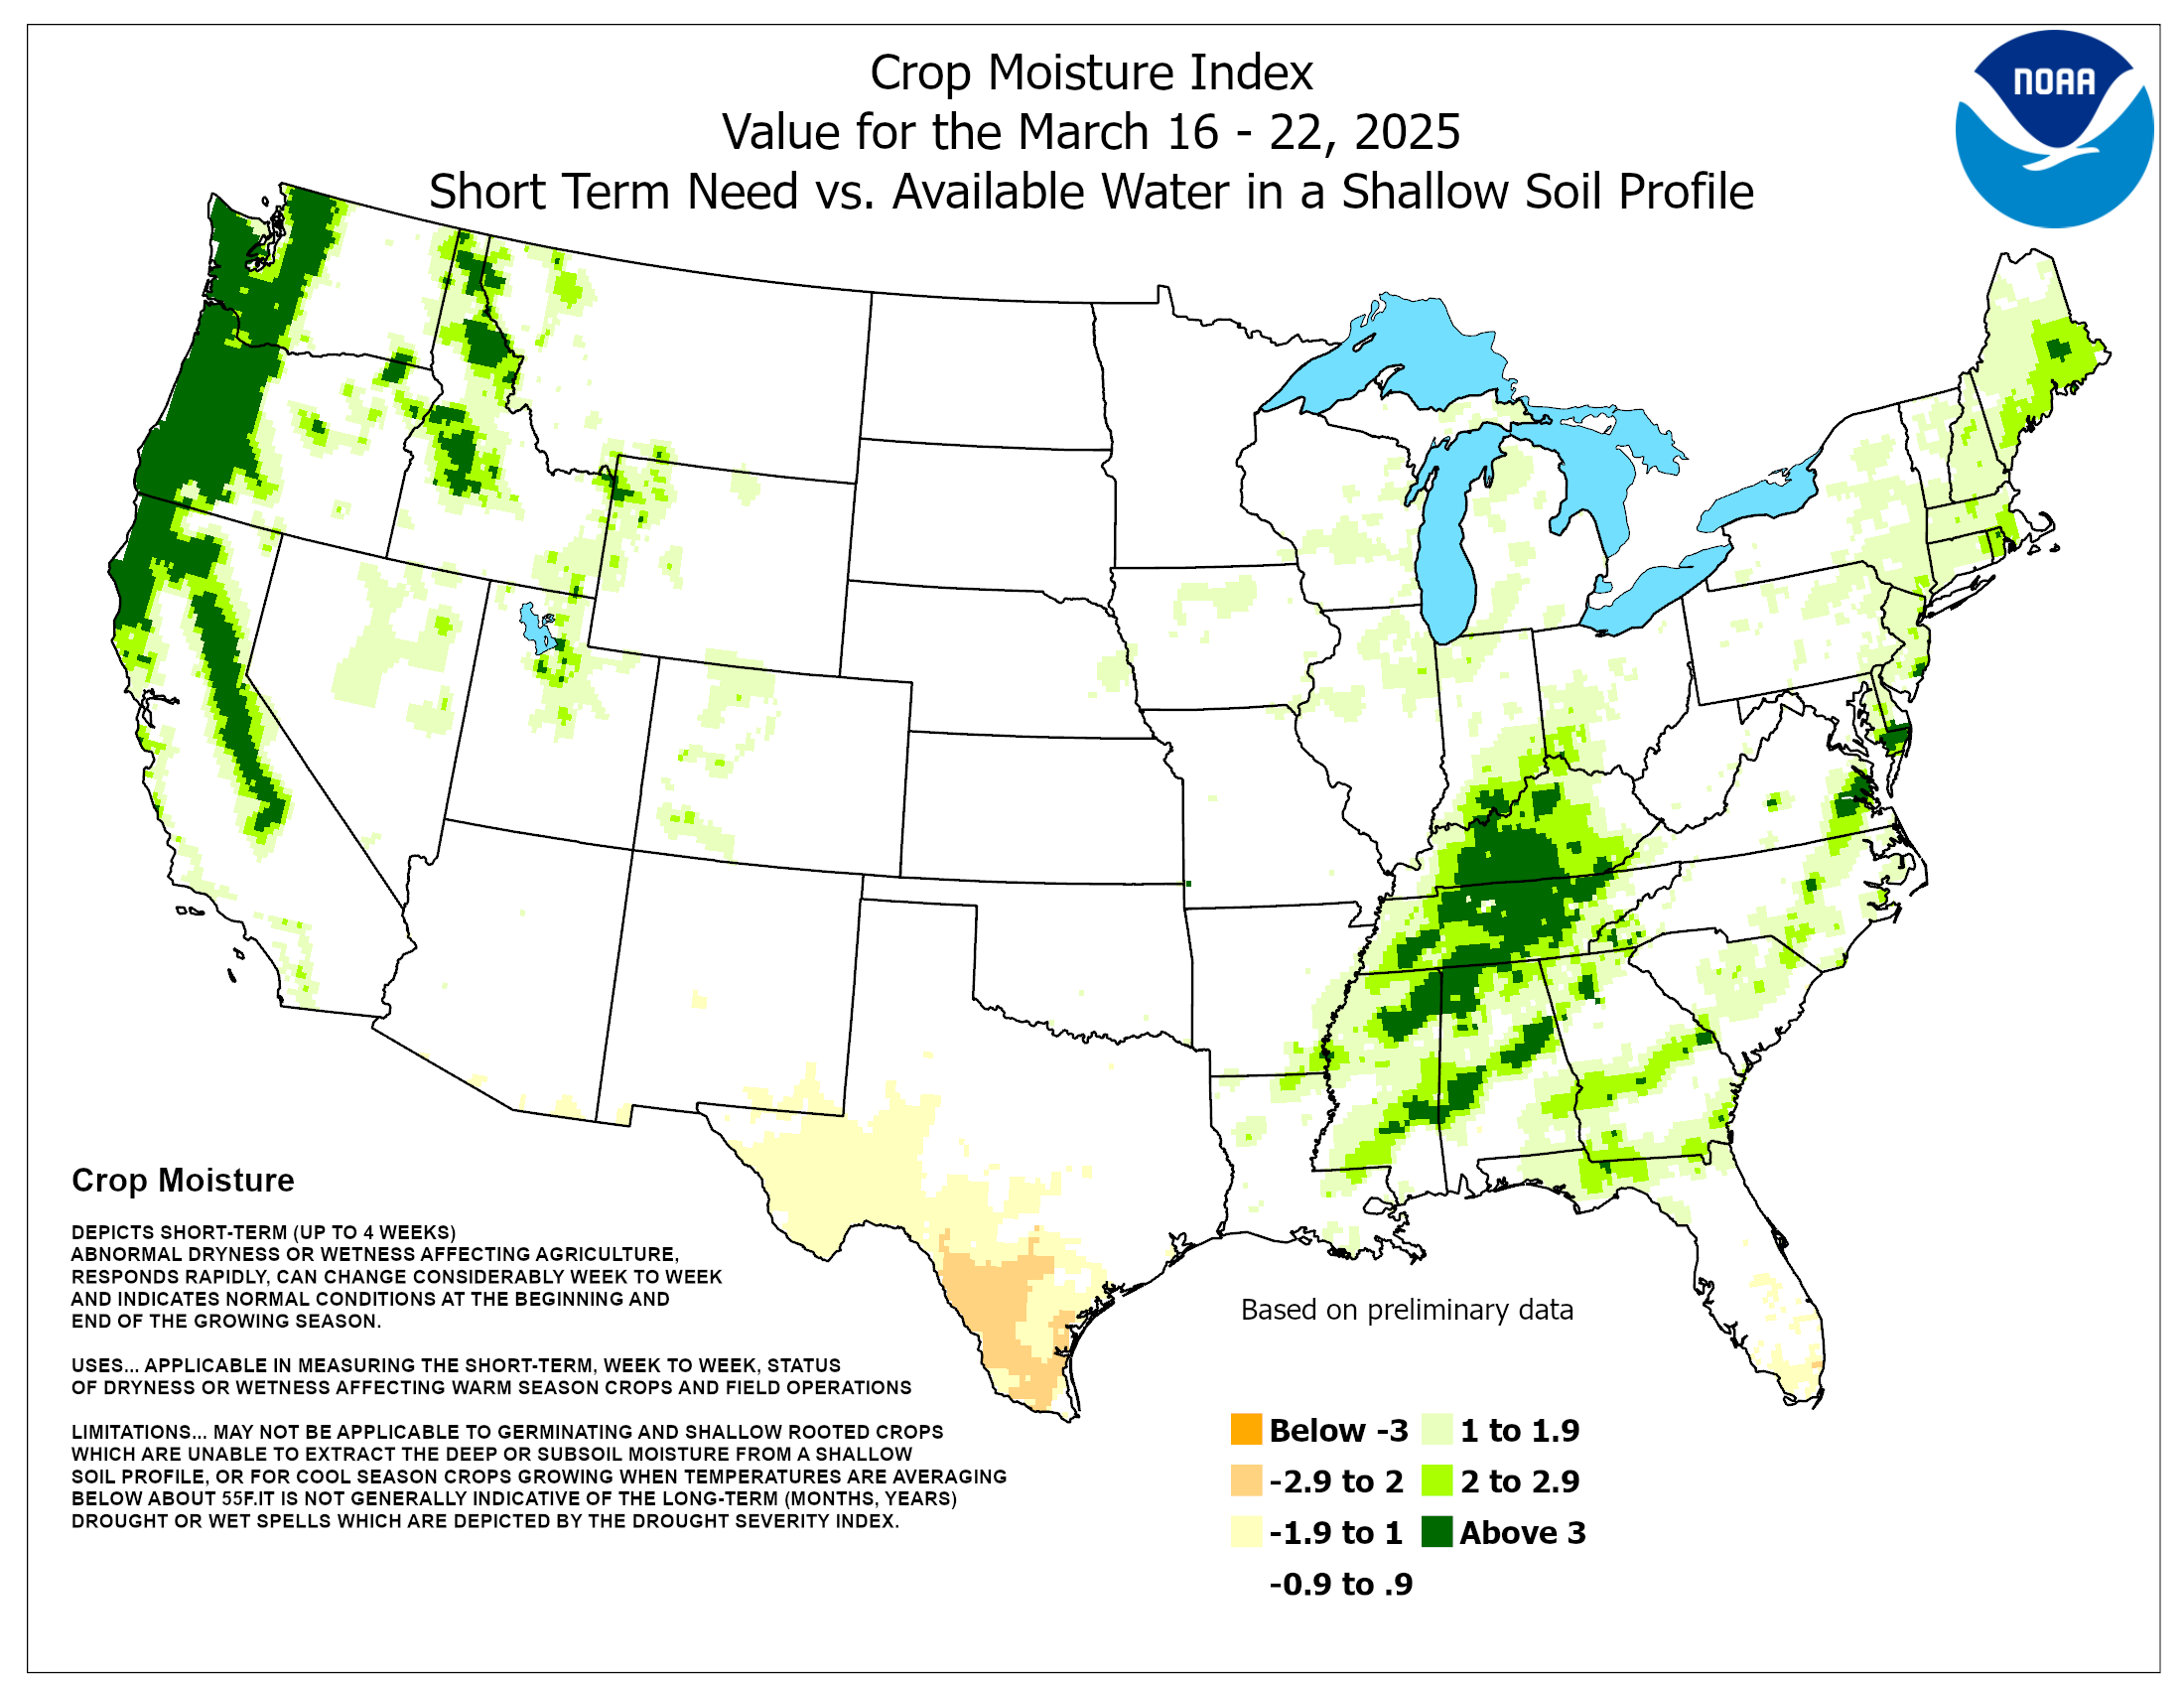 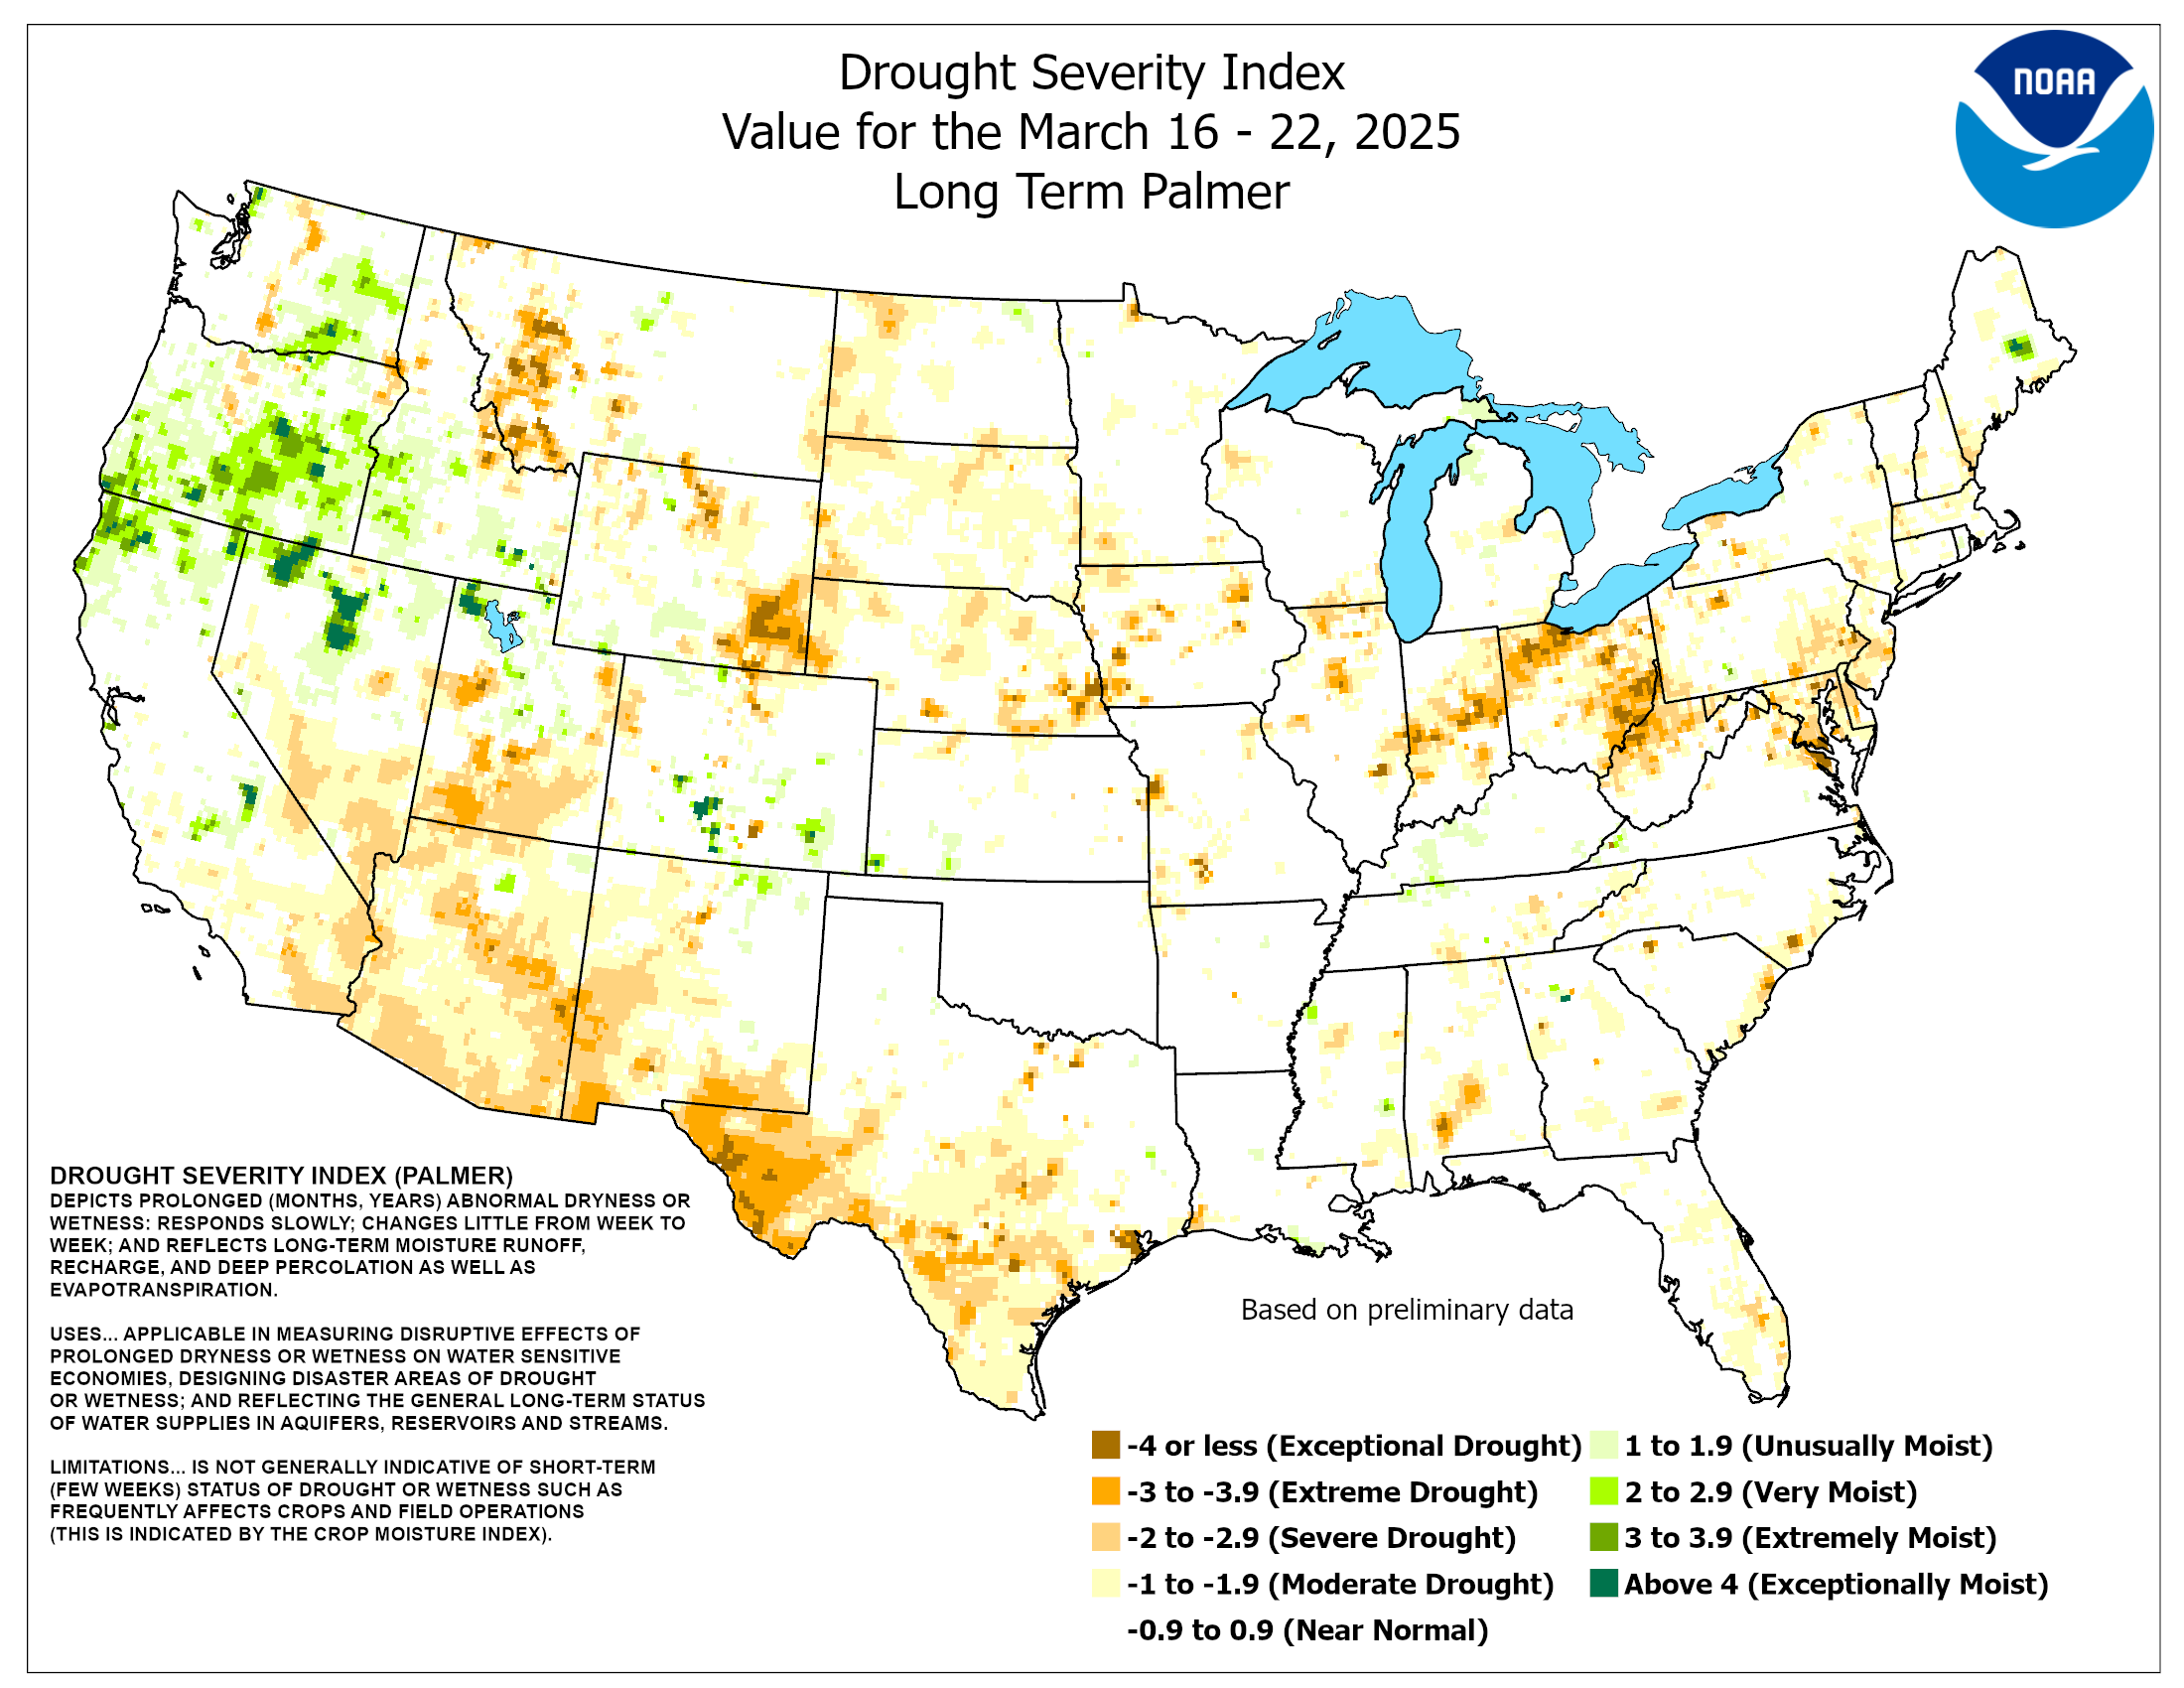     Local Drought Information Statement ‚ě§ Issued May 1st Handbook of Drought Indicators and Indices - WMO-No. 1173 U.S. Drought Monitor: • Florida Drought Monitor: • ≤©ŐŚ”ż Tampa Bay Drought Monitor: • USGS: • • Florida Water Management Districts: • • • Keetch-Byram Drought Index (KBDI): • Climate Prediction Center: Long Term Palmer Drought Severity Index (PDSI) Graphic U.S. Crop Moisture Index (CMI) Graphic Miscellaneous: |
| Local Rainfall Tables | Water Restrictions By County or City if different | ||||
Water Year Rainfall ")
2025 Rainfall  |
|
||||
| Precipitation Analysis Links | |||
|
|||
| Precipitation Analysis Graphics | |||
| If the map below does not open properly, try closing the Layers |
|||
| To view a different date/time range, scroll down within the Layers box and open the Precipitation Estimate section. |
|||
| Localized WPC Precipitation Forecasts | Precipitation Forecast Links | ||
24-Hour Precipitation Total - Day 1 24-Hour Precipitation Total - Day 2  __________________________________________________ 24-Hour Precipitation Total - Day 3 72 Hour Precipitation Total - Days 1-3   __________________________________________________ Days 4-5 Precipitation Total Days 1-5 Precipitation Total   __________________________________________________ Days 6-7 Precipitation Total 7-Day Precipitation Total   |
|