| Introduction |
| Drought Monitor Status |
| Local Drought Statements |
| Recent Temp & Precip |
| Impacts |
| Water Resource |
| Forecasts & Outlooks |
| Past Droughts |
Introduction/Acknowledgements
Information about current drought conditions and forecast conditions can be found on the tabs following this one. Items range from basic level to in-depth items. Below are some basic questions about drought, and where on this page you can find the answers.
Fire weather information is available on the Fire Weather Page
Acknowledgements
Images Courtesy of...
|
|
 |
 |
 |
 |
 . |
Drought Status
US Drought Monitor Information for Indiana:

Latest Drought Statements (when available)
| from |
| from |
| from |
| from |
| from |
| from |
Latest Precipitation and Temperature Trends
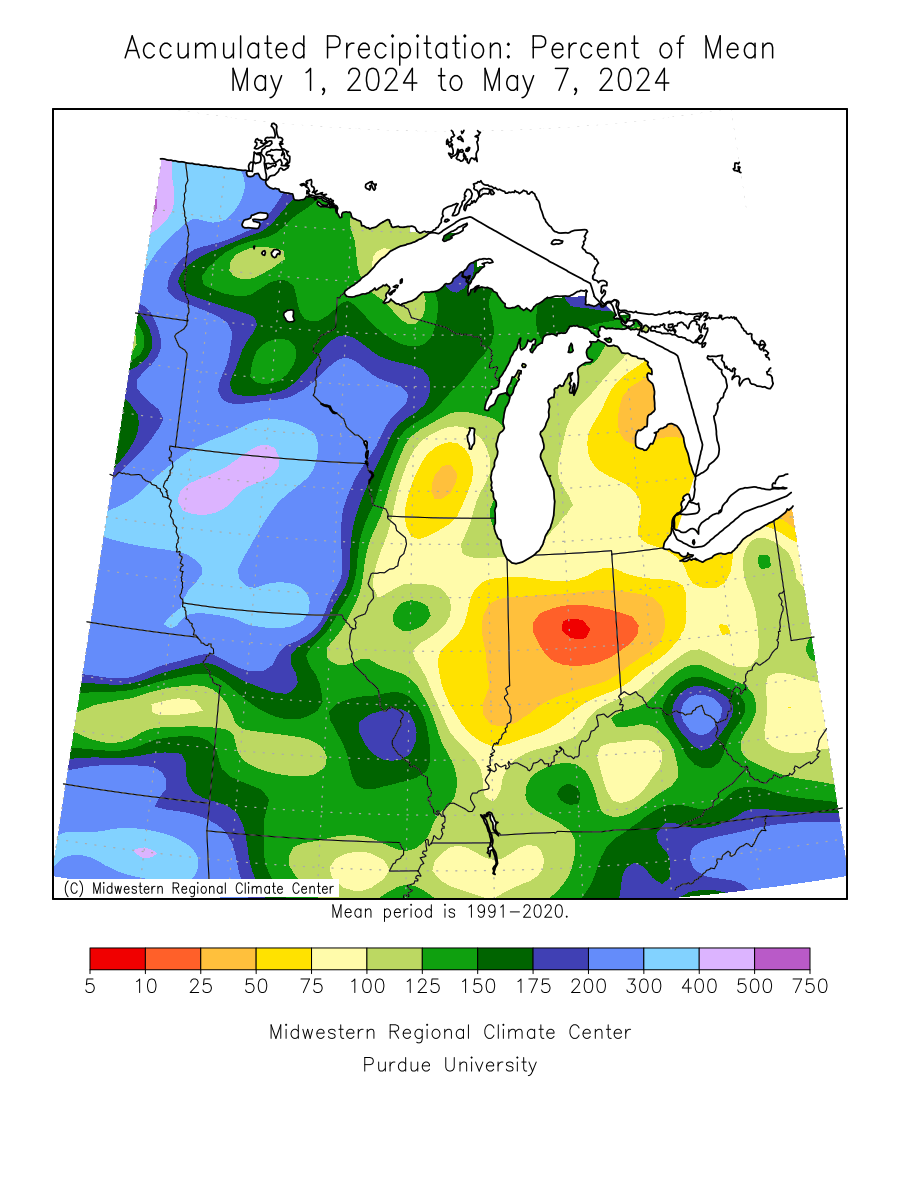
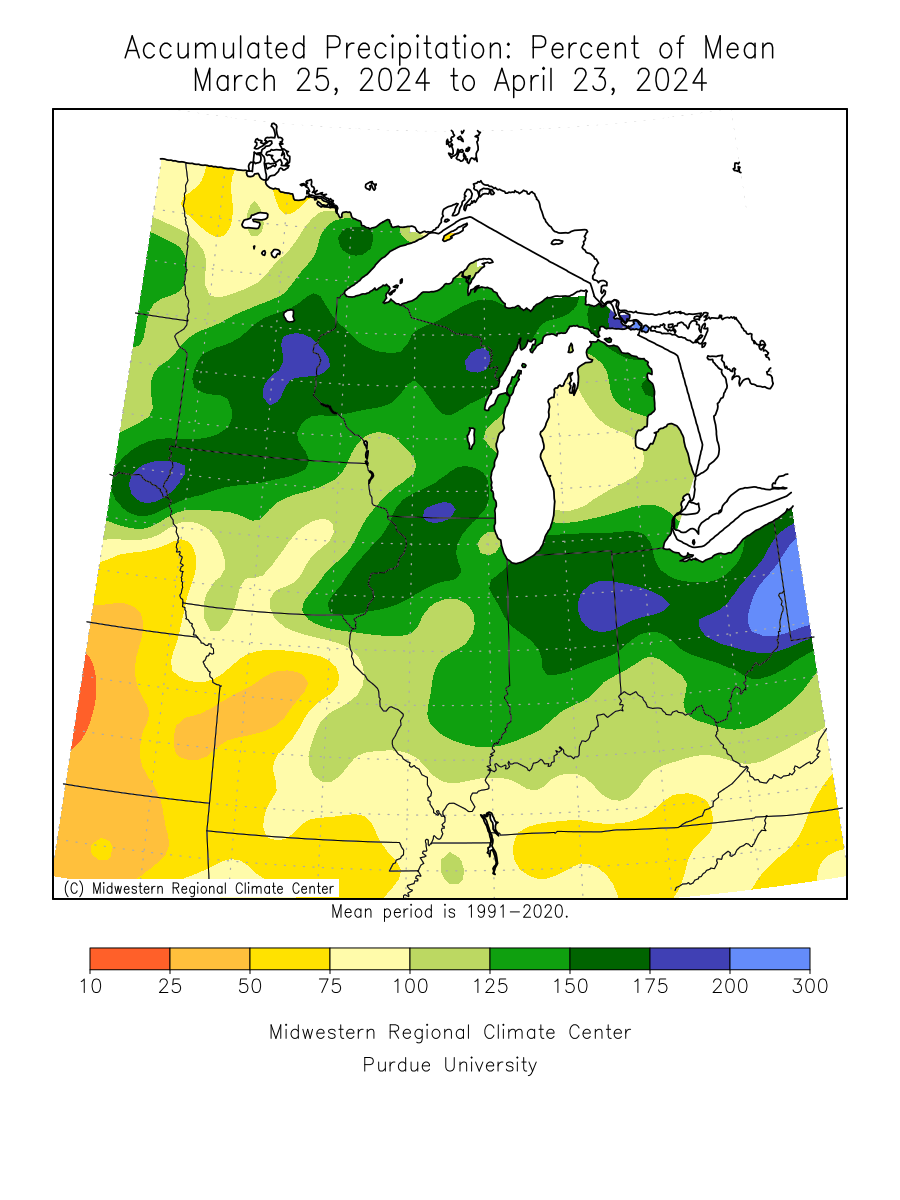
7 Day, 30 Day, 60 Day, 90 Day, and 120 Day Precipitation Percent of Normal:
|
|
|
 |
 |
 |
 |
SPI/SPEI Maps for Indiana:
7 Day and 30 Day Temperature Departure from Normal
 |
 |
Plot of Year-to-Date Temperatures and Precipitation for Indianapolis (Other cities are available), and Plot of Snow Year (July-June) for Indianapolis
 |
 |
Impacts
Soils / Vegetation
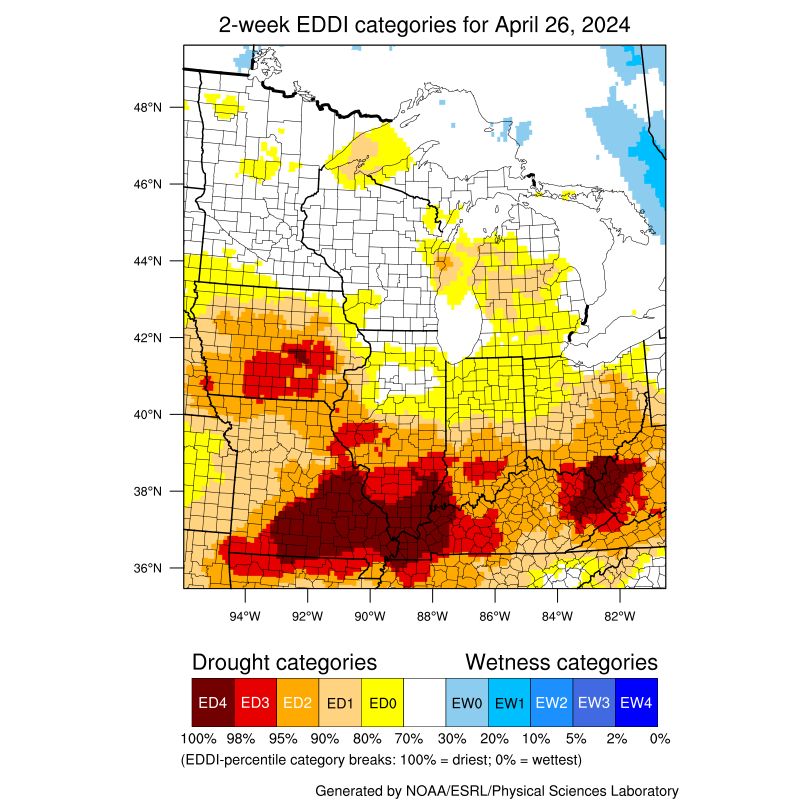
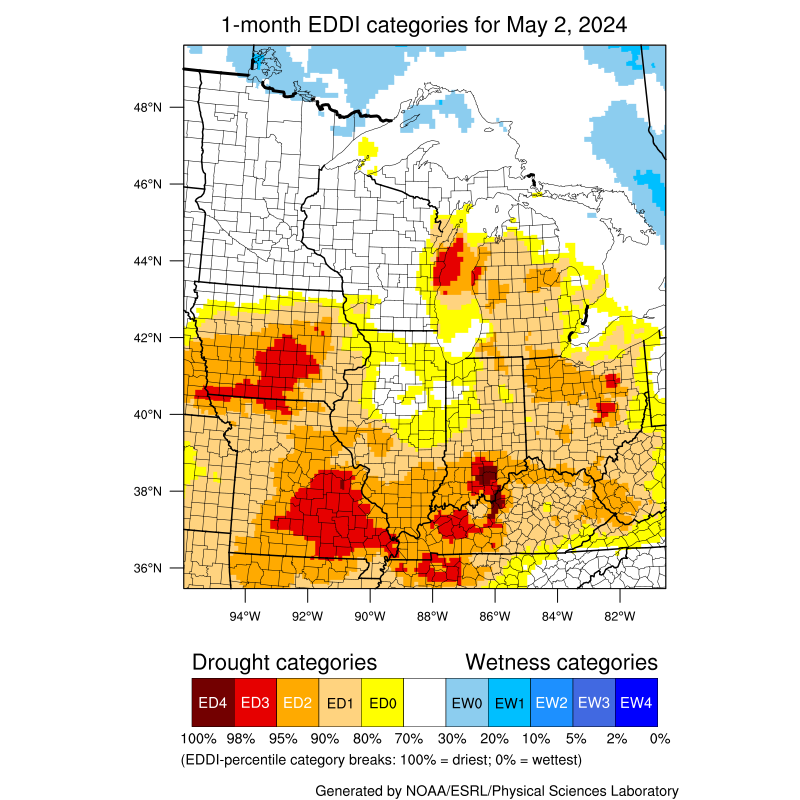
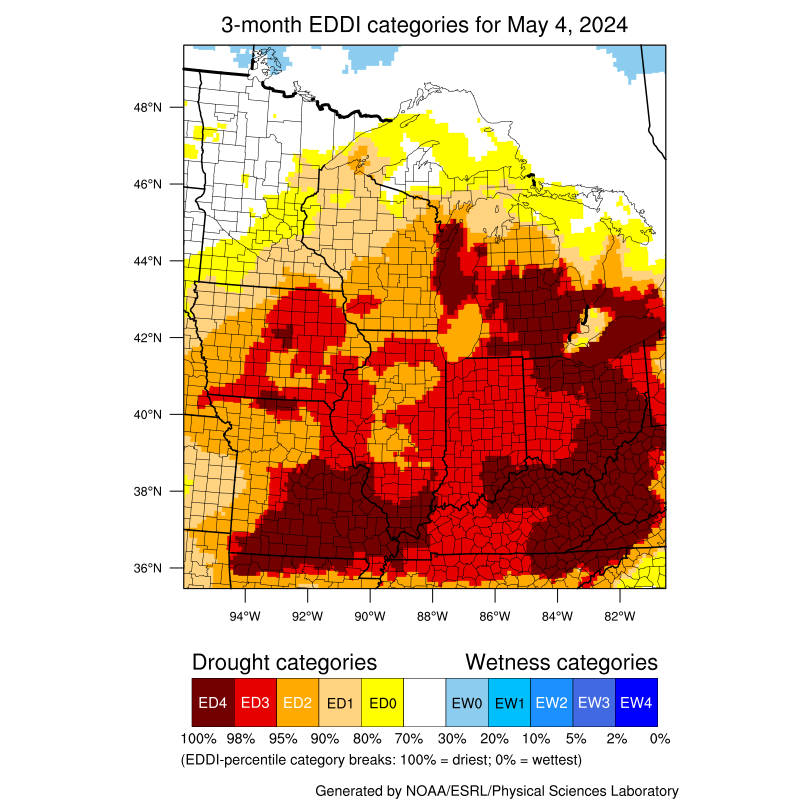
EDDI: 1 week, 2 week, 1 month, 3 month
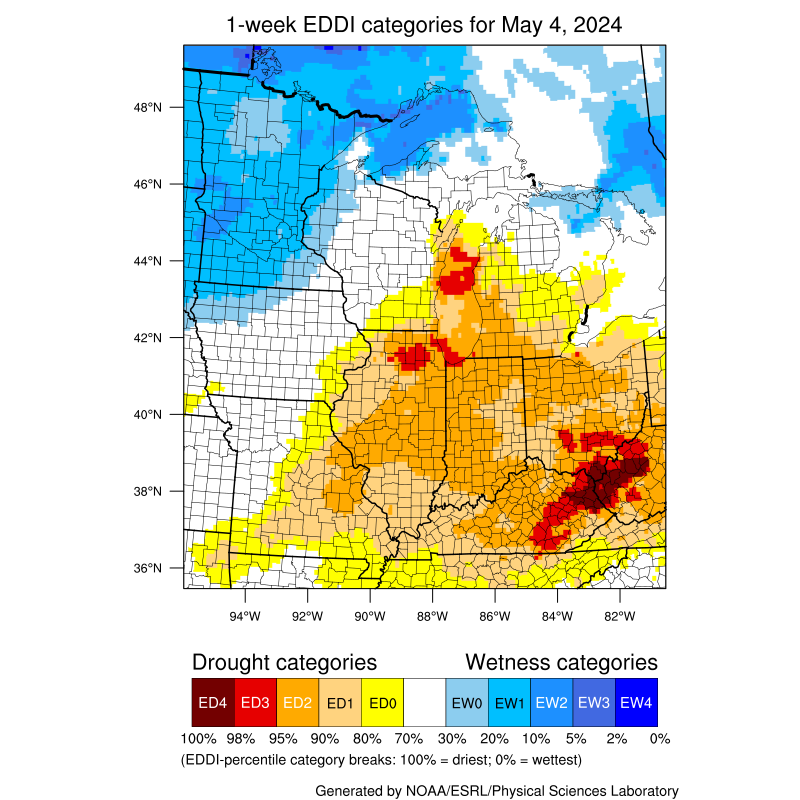 |
 |
 |
 |
Soil Moisture: (more soil moisture info )
Calculated Soil Moisture Ranking Percentile:
Total Soil Moisture Anomaly:
|
|
(choose 0-100cm RSM, 0-100cm Percentile, INT-RSM: 1wk chg)
Vegetation Drought Response Index:

Palmer Index Information
(Caution! These maps may not be accurate at the moment)
 |
 |
| Drought Severity Index (Long Term Palmer) | Additional Precipitation Needed to Bring Palmer Index to Near Normal |
Other Impacts
Water Resources
Stream flow for Rivers Across Indiana (all stream flow images from )
| Current: |
Key:
|
7 Day 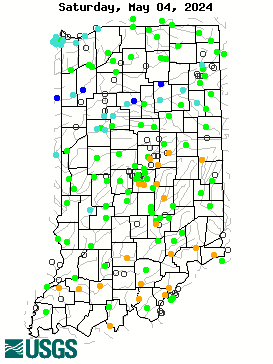 |
 |
28 Day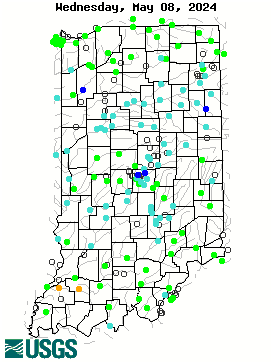 |
|
(Indiana Ground Water Watch was deactivated)
USCAE Lake Levels: ,
Forecasts & Outlooks
Latest 7-Day Total Precipitation Forecast (updated daily by 7 p.m. EDT) from :

6-10 day temperature outlook:

6-10 day precipitation outlook:

8-14 day temperature outlook:

8-14 day precipitation outlook:

Latest One Month Temperature Outlook from the :
Latest One Month Precipitation Outlook from the :
Latest Three-Month Temperature Outlook from the :

Latest Three-Month Precipitation Outlook from the :
Experimental from MRCC
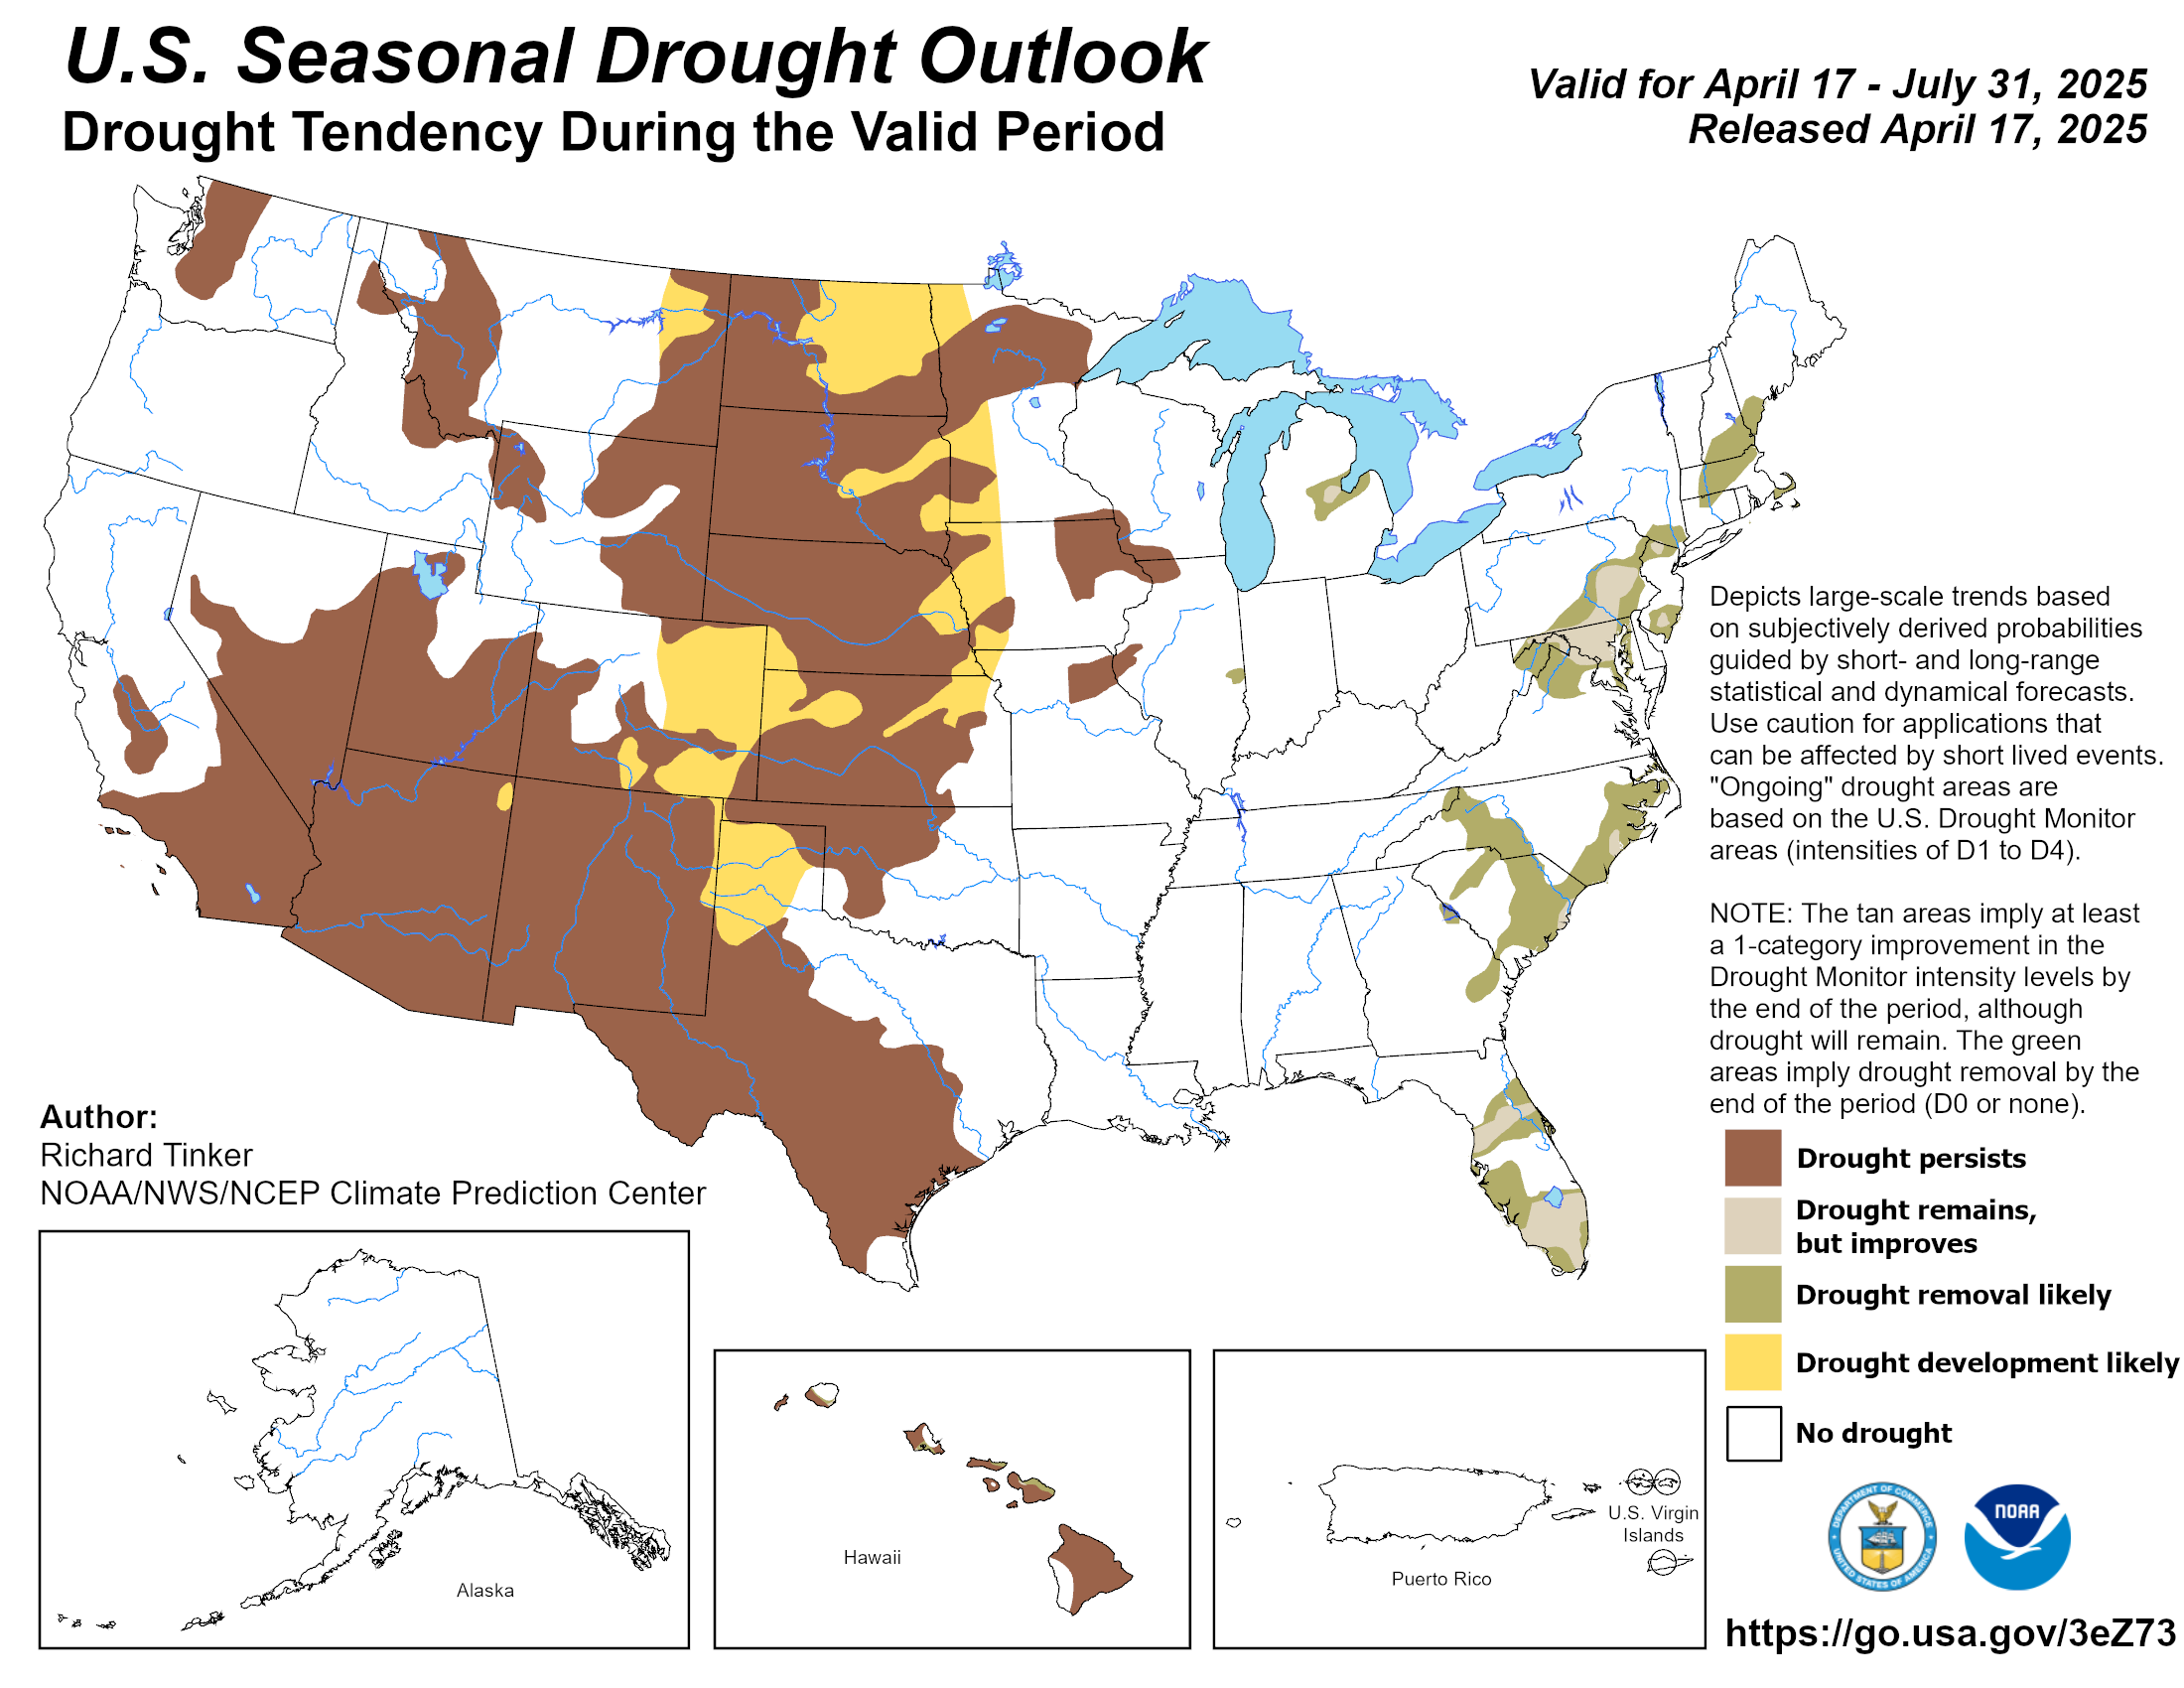
Seasonal Drought Outlook:
Past Droughts
Below are notable droughts since the year 2000. Archived drought maps back to 2000 are available at the US Drought Monitor . Older data can be found at the NIDS . Click any image for a full size version.
 |
 |
|
(Additional information on the 2012 heat and drought is available) |
 |
Media use of ˛©ĚĺÓý Web News Stories is encouraged! Please acknowledge the ˛©ĚĺÓý as the source of any news information accessed from this site. |
|